Not all trading strategies depend on upward or downward trends. In fact, only traders who truly understand volatility can turn risk into advantage. Volatility trading concepts focus on measuring, analyzing, and trading based on the intensity of price fluctuations, thereby helping traders build strategies that adapt to all market conditions.
- Market structure trading: How traders identify trend and market direction
- How fair value gap trading helps traders optimize entry points
- How order block trading reflects institutional buying and selling pressure
What are volatility trading concepts?
Volatility trading concepts aim to profit from price fluctuations, whether the market is rising or falling. By understanding this volatility, traders can apply various flexible strategies to take advantage of trading opportunities in highly volatile environments and sideways phases.
High volatility
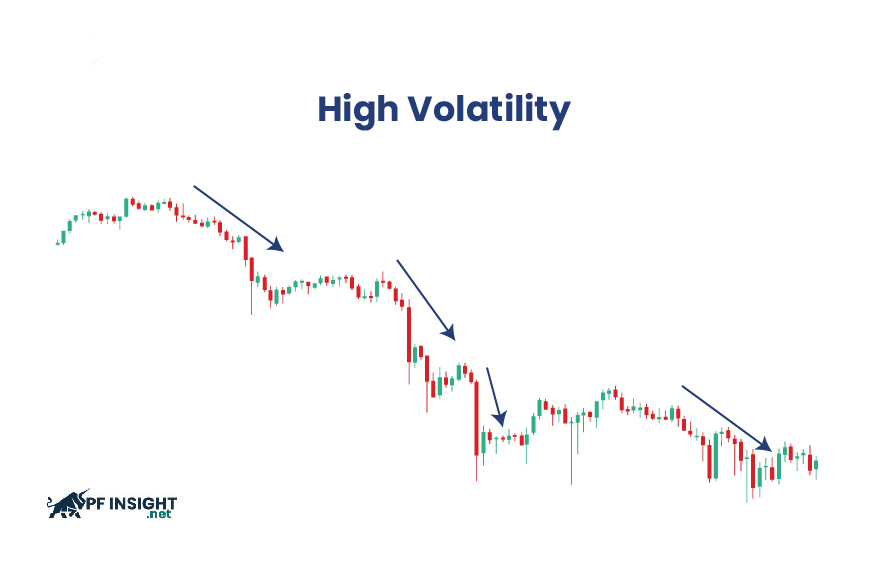
High volatility indicates that asset prices change dramatically in a short period of time. For traders, this is both attractive and risky. While large price swings can generate quick profits, they also increase the risk of losses if traders lack a proper risk management strategy.
For example, when important economic data is released or unexpected news emerges, the market often reacts strongly. Prices can fluctuate rapidly in a short period, creating unpredictable ups and downs for traders.
Low volatility
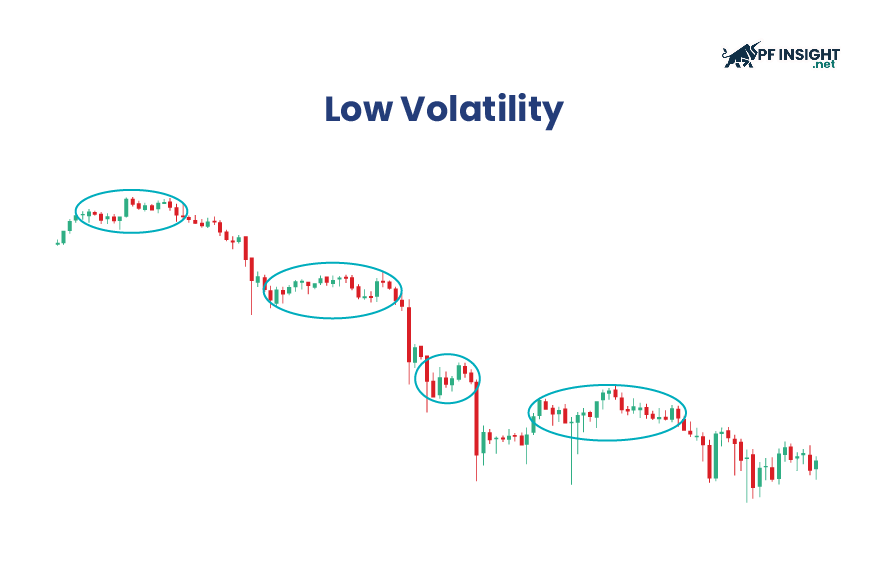
Low volatility reflects the fact that asset prices fluctuate within a narrow range over time. Under these conditions, the market typically operates stably, with price changes occurring slowly and less abruptly than during periods of high volatility.
Low-volatility markets often provide a sense of security and control for long-term investors. This environment is suitable for strategies aimed at stable returns and moderate risk. However, risk is not entirely eliminated, as unpredictable factors such as economic crises, monetary policy changes, or unexpected news can still significantly impact prices.
Common types of volatility in trading
Understanding the different types of volatility is a crucial foundation in volatility trading concepts, helping traders build appropriate strategies and improve trading efficiency.
Market volatility – Implied volatility – Historical volatility
- Market volatility: Market fluctuations reflect changes in prices that are directly recorded over a given period. This is the process of prices moving continuously in real time, reflecting the market’s reaction to supply and demand factors.
- Implied volatility: Implied volatility is a measure of the market’s expectation of future price fluctuations. It is not based on past price movements, but is calculated from the prices of options contracts currently being traded.
- Historical volatility: Reflects the degree of price fluctuations of an asset in previous periods. By analyzing this data, traders can identify recurring trends and build reasonable forecasts for future price movements.
Event-Driven volatility
In volatility trading concepts, various specific events can trigger sudden market volatility, creating sharp changes in price rhythm and amplitude.
- Corporate financial reports: The quarterly release of business results often causes significant price fluctuations, especially when actual figures differ considerably from market expectations.
- Macroeconomic data: Information such as unemployment rates, inflation, or GDP growth rates can directly influence investor sentiment and behavior.
- Political factors: Events such as elections, policy adjustments, or geopolitical tensions often increase uncertainty, thereby fueling market volatility.
- For example, during the 2024 US presidential election, the market witnessed unusual reactions. While actual price movements remained relatively stable, implied volatility was high due to anxiety and uncertainty surrounding the election outcome.
Seasonal volatility in markets
An important part of volatility trading concepts is identifying markets that tend to fluctuate seasonally in order to optimize trading timing.
- Retail sector stocks: Prices often fluctuate sharply during peak shopping seasons, when consumer demand increases or decreases significantly.
- Agricultural products: Weather conditions and seasons directly affect production, thereby creating cyclical price fluctuations at different times of the year.
By understanding volatility patterns, traders can proactively anticipate upcoming changes. This helps them prepare appropriate strategies and react promptly to potential market fluctuations.
A guide to assessing price volatility in trading
Accurately measuring volatility is a key factor in helping traders implement effective strategies and better manage risk.
- Standard deviation: Standard deviation is an indicator used to measure the degree of dispersion in price data. In trading, it shows how far an asset’s price fluctuates from the average over a given period. The larger the standard deviation, the more volatile the market.
- Average True Range (ATR): ATR is an indicator used to measure market volatility through the price fluctuation range over a specific period. This indicator not only considers highs and lows, but also takes into account price gaps, helping to more accurately reflect the actual volatility of an asset.
Volatility trading strategies in highly volatile markets
Volatility trading focuses on exploiting price fluctuations to seek profits. According to volatility trading concepts, traders need to understand market dynamics and flexibly use appropriate indicators and tools. This method does not rely entirely on trends but emphasizes the intensity of volatility.
Here are some common strategies for volatile markets.
Volatility breakout trading strategy
This strategy focuses on opening positions when the price breaks out of a familiar trading range, anticipating strong movements. Traders need to identify periods of low market volatility, when the price moves sideways within a narrow range, and be ready to act when the price breaks through key levels. The goal of this method is to capitalize on quick breakouts to seek large profits.
Mean reversion trading strategy
The average regression strategy is based on the assumption that the price of an asset cannot deviate too far from its long-term average. When prices rise or fall sharply against historical data, traders expect the market to correct and return to equilibrium. By identifying these unusual deviations, traders can look for potential trading opportunities across various markets such as stocks, forex, and commodities.
Swing trading strategy
Swing trading is a trading method where traders hold positions for a few days to a few weeks to take advantage of price fluctuations. According to volatility trading concepts, this strategy exploits short- and medium-term volatility through technical analysis to identify optimal entry and exit points. This approach is suitable for traders who want to balance trading flexibility with a long-term investment orientation.
The most effective indicators for volatility trading
According to volatility trading concepts, applying the right technical indicators can help traders accurately analyze market behavior during periods of high volatility. These indicators provide crucial signals for building and optimizing volatility trading strategies.
Bollinger Bands and volatility trading
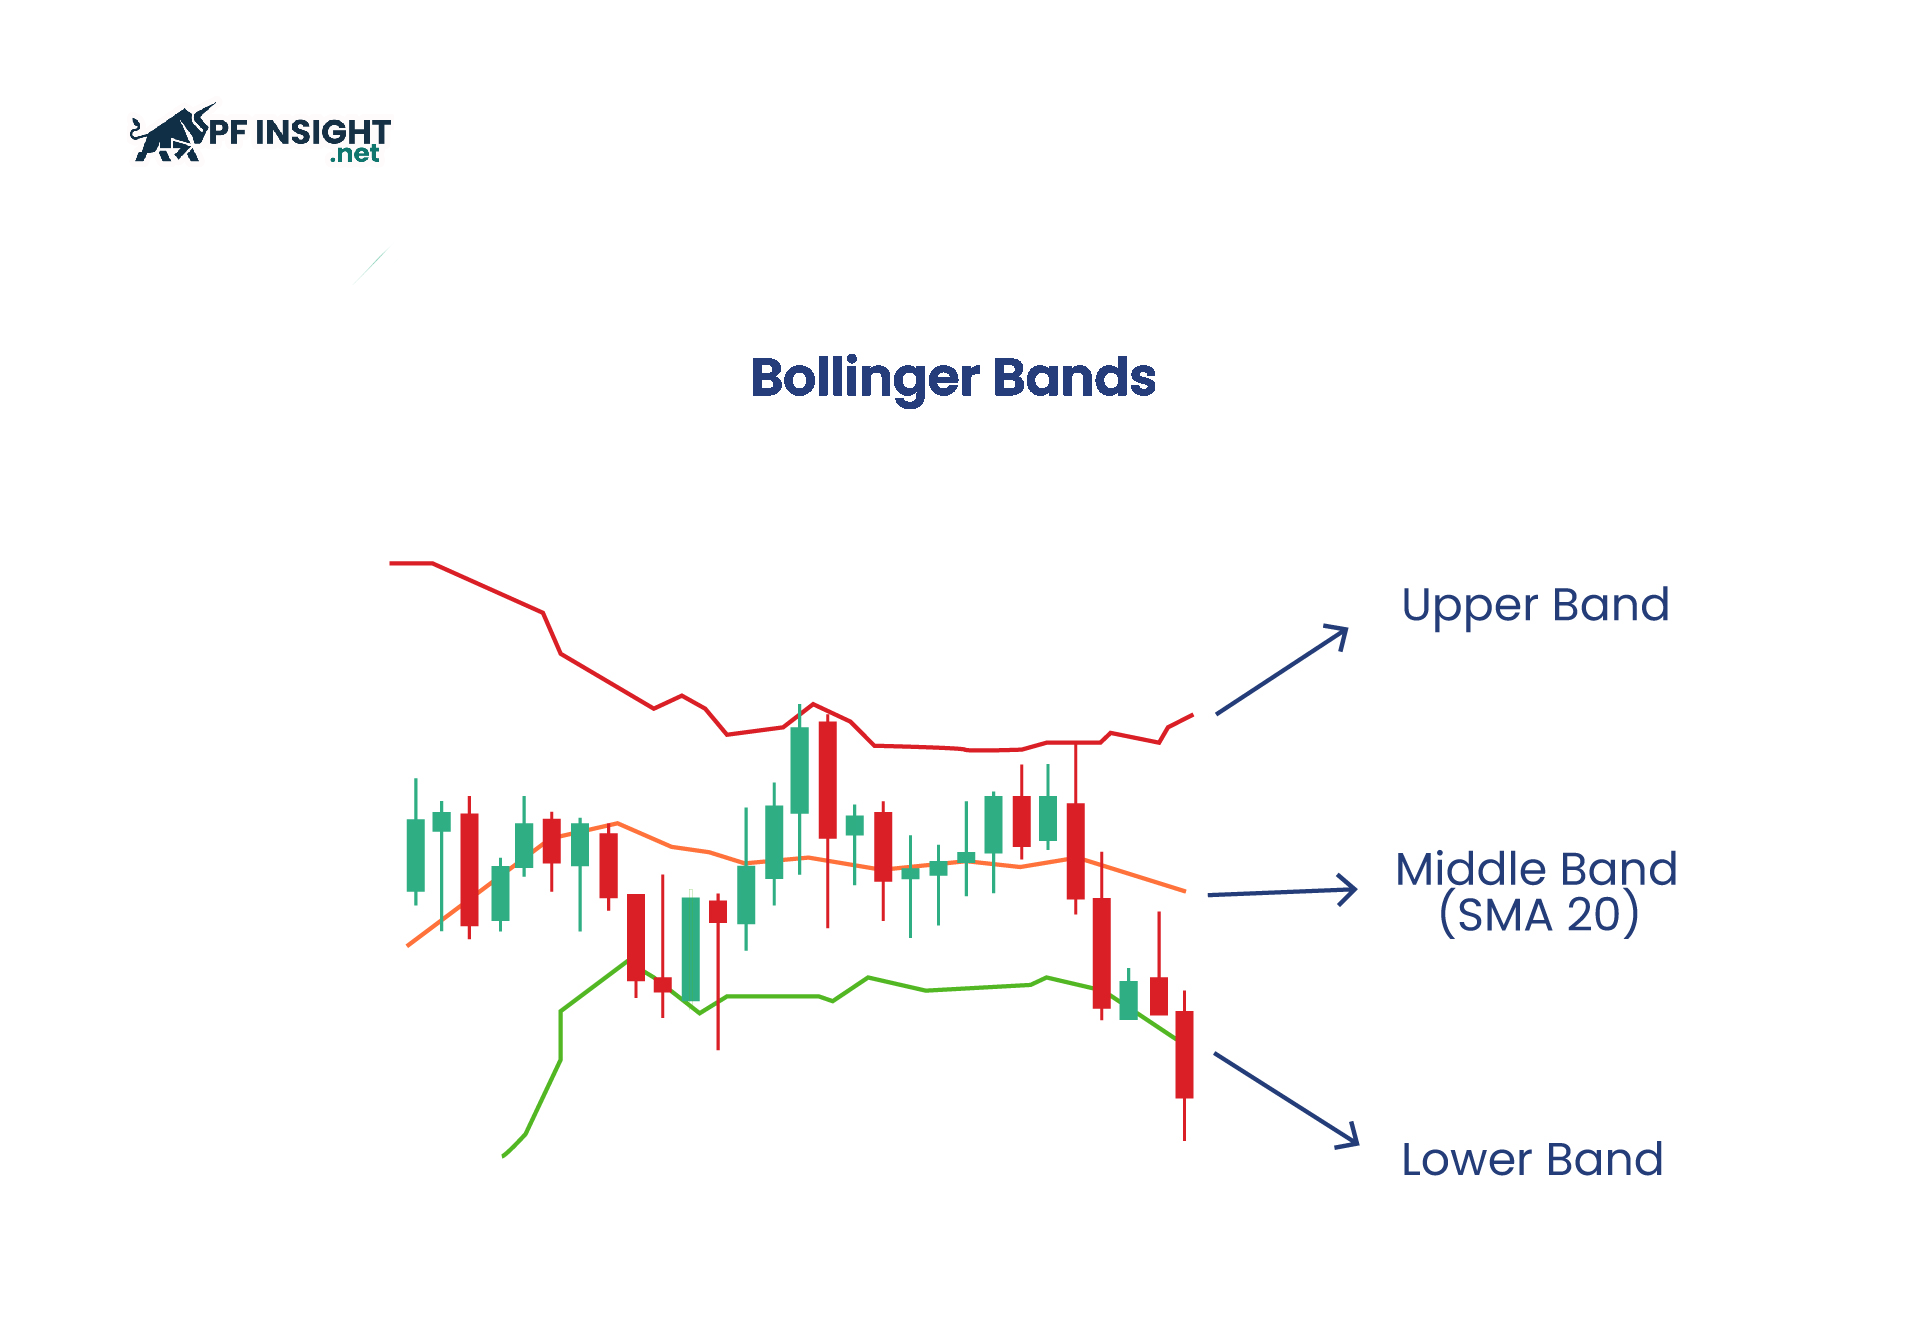
Bollinger Bands consist of a moving average in the middle and two boundary bands based on standard deviation. When the market experiences high volatility, the bands widen, and when volatility decreases, the distance between the bands tends to narrow.
- When the bands widen significantly, this reflects a marked increase in market volatility.
- When the bands narrow, the market typically enters a period of lower volatility, and prices move within a narrow range.
Traders often monitor breakouts from upper or lower bands as potential signals for the formation of new price movements.
Relative Strength Index (RSI)
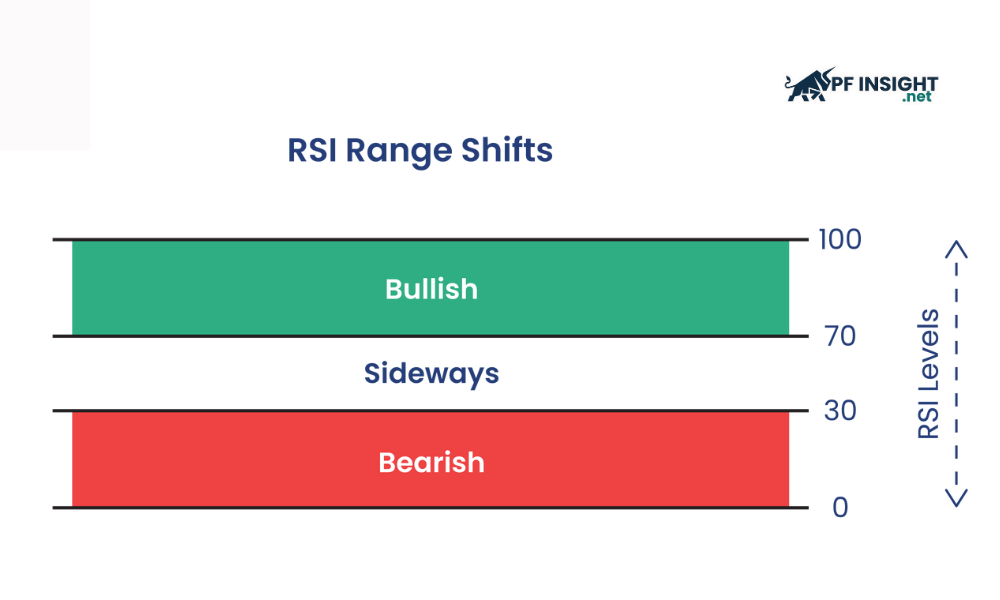
The RSI (Relative Strength Index) is a momentum indicator that reflects the speed and magnitude of price changes over time. This indicator ranges from 0 to 100, with values above 70 typically indicating an overbought condition, and values below 30 suggesting an oversold market.
In volatility trading concepts, RSI is used to detect potential reversals when the market experiences high volatility. This indicator helps traders identify when an asset is in an overbought or oversold state, thereby finding suitable trading opportunities.
Moving Average Convergence Divergence (MACD)
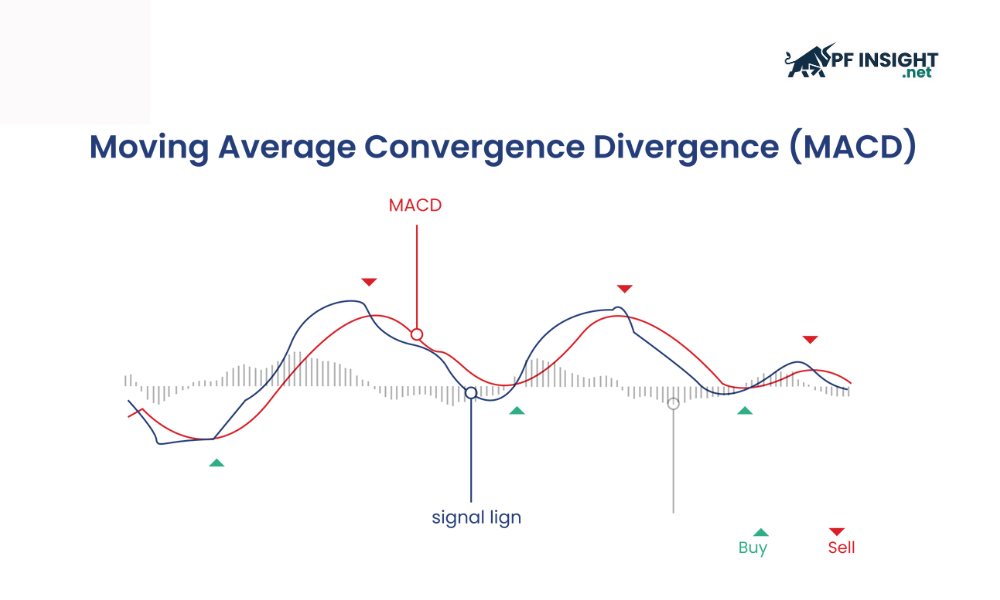
MACD is a trend and momentum indicator used to analyze the relationship between moving averages of price. This indicator consists of the MACD line, a signal line, and a histogram. The MACD line is calculated as the difference between the 12-period EMA and the 26-period EMA, while the signal line is the 9-period EMA of the MACD.
In volatility trading concepts, traders often monitor the crossover points between the MACD line and the signal line to find buy or sell signals. When the market is highly volatile, the MACD helps confirm the strength of the trend and guide price movement.
Risk management tips for volatility trading
Based on volatility trading concepts, the following advice helps traders improve their decision-making ability when trading in highly volatile conditions.
- Applying trend lines: When market volatility is low, drawing and tracking trend lines helps clarify the main direction of price movement, thereby supporting traders in making more accurate and informed decisions.
- Avoid being swayed by crowd psychology: While popular trends often attract attention, traders should rely on independent analysis and personal trading plans, rather than following the general market sentiment.
- Responding flexibly to news: During periods of low market volatility, new information can trigger unexpected price reactions. Having scenarios prepared and acting promptly helps traders better seize opportunities.
- Exploiting price gaps: Even in stable markets, price gaps can still appear. Identifying and trading around these gaps can unlock potential profit opportunities.
- Planned risk management: Low market volatility does not mean absolute safety. Traders need to carefully evaluate each opportunity and only accept a level of risk that aligns with their established strategy.
Conclude
In summary, volatility trading concepts offer a flexible approach, helping traders capitalize on opportunities in both volatile and stable markets. According to PF Insight, effectiveness is only achieved through a combination of knowledge, discipline, and rigorous risk management.


