
In trend trading, understanding and identifying pullbacks is a key factor that helps traders determine optimal entry points while minimizing risk. A pullback allows traders to join an existing trend during temporary price retracements, rather than chasing breakouts or trying to catch tops and bottoms.
Knowing the types of pullback helps traders distinguish between a “healthy” correction within a trend and a potential reversal signal. By recognizing the characteristics, price behavior, and confirmation patterns of each type, you can trade with greater confidence and precision.
In today’s article, PF Insight will walk you through the three most common types of pullback, how to identify them on the chart, and the most effective trading strategies for each.
- What is a pullback in trading and why it matters
- What are EA trading rules? The ultimate guide to effective automated trading
- Prop firm risk management: essential tips for traders
What is a pullback in trading?
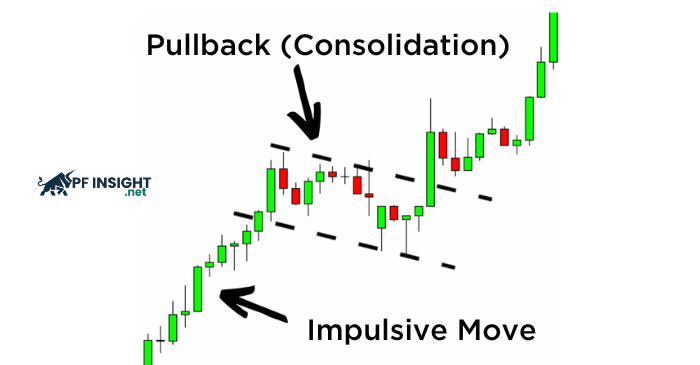
A pullback is a temporary price correction within a primary trend. Simply put, when the market is in an uptrend, there will often be short-term declines before prices continue rising; or in a downtrend, prices may rebound slightly before resuming their fall. Unlike a trend reversal, a pullback represents a retracement, not a change in the overall direction.
Pullbacks reflect the market’s “pause” after a strong price move. They often occur when traders take short-term profits or when momentum temporarily slows down before continuing in the same direction.
Understanding the true nature of pullbacks helps traders stay calm during corrections and even see them as opportunities to rejoin the main trend at a better price. This is why distinguishing between different types of pullback in trading is so important; not all retracements are created equal.
Example:
- In a strong uptrend on the EUR/USD pair, if the price dips slightly to retest the 20 EMA support and then bounces higher, this is considered a healthy pullback.
- However, if the price breaks below that support and continues to fall, it could signal the start of a trend reversal, rather than a simple pullback.
Main types of pullback in trading
Not all price corrections are the same. In price action trading, types of pullback in trading are generally divided into three main categories: shallow pullback, deep pullback, and complex pullback. Each type has distinct characteristics in terms of depth, price behavior, and the ideal entry timing.
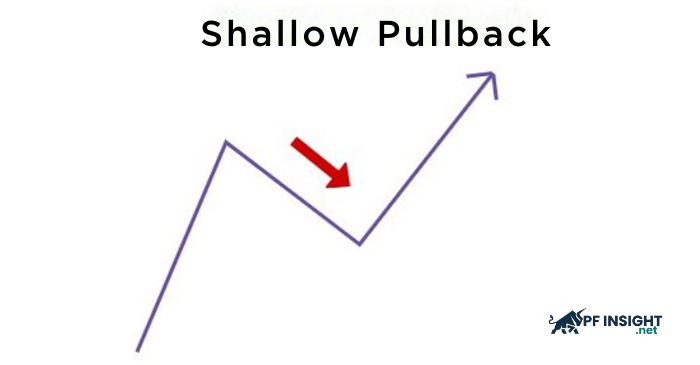
Shallow pullback
A shallow pullback is a minor correction that usually occurs during a strong trend. The price only retraces slightly before continuing in the main direction.
Key characteristics:
- Price often touches the 9 EMA or 20 EMA before bouncing back.
- Short retracement period with decreasing volume.
- Small-bodied or long-tailed candles indicate weak selling pressure (in an uptrend).
Trading strategy:
- Look for confirmation candles such as a bullish engulfing or pin bar.
- Enter when a confirmation candle appears or when the recent swing high is broken.
- Place the stop loss below the latest pullback low (in an uptrend).
Deep pullback
A deep pullback occurs when the price retraces deeper than usual, often testing the 50 – 61.8% Fibonacci zone or a strong previous support/resistance level.
Key characteristics:
- Appears after a strong move, when the market needs to “cool down.”
- Often mistaken for a trend reversal because of the sharp retracement.
- Signs of strong support include declining volume and reversal candles like doji or hammer.
Trading strategy:
- Use Fibonacci retracement or trendlines to identify potential support zones.
- Wait for confirmation via a reversal candle or break of structure (BoS) before entering.
- Manage risk carefully If the price breaks below the 61.8% level, the trend may be weakening.
Complex pullback
A complex pullback is an extended correction made up of multiple smaller waves, reflecting a market in consolidation or low momentum. It often forms recognizable patterns like channels, flags, or wedges.

Key characteristics:
- Price fluctuates up and down several times before breaking out.
- Volume gradually decreases during the formation.
- Takes more time to complete than a shallow or deep pullback.
Trading strategy:
- Draw trendlines or price channels to define the pullback structure.
- Enter after a breakout from the pattern, ideally with a retest for confirmation.
- Place the stop loss outside the pattern (above resistance or below support).
How to identify each type of pullback
Learning how to recognize the three forms of pullback on actual charts is a crucial next step after comprehending them. Recognizing the correct type of pullback allows you to choose the most suitable trading strategy and avoid entering trades at the wrong time. Below are several tools and methods to effectively identify each type of pullback in trading:
Using Exponential Moving Averages (EMA)
The EMA is a simple yet highly effective tool for identifying the strength or weakness of a pullback.
Shallow pullback:
Price typically touches the 9 EMA or 20 EMA before bouncing back in the main trend.
Indicates strong momentum; buyers (or sellers) remain in control.
Deep pullback:
Price often retraces to the 50 EMA or 100 EMA, showing that momentum is slowing.
If the candle closes below these EMAs, caution is needed; a potential reversal may form.
Complex pullback:
Price moves back and forth around the EMAs with no clear touches.
This signals a consolidation or indecision phase in the market.
Using Fibonacci retracement to measure correction depth
The Fibonacci retracement tool helps you gauge the depth of a pullback and identify potential entry zones.
Shallow pullback: Price stalls around the 23.6% – 38.2% retracement zone.
Deep pullback: Price typically reaches the 50% – 61.8% levels.
Complex pullback: Price fluctuates within a wider range, sometimes up to 78.6%, before continuing the trend.
Using trendlines and market structure
Drawing trendlines or price channels helps visualize the direction of a pullback and identify when the correction might be ending.
Shallow pullback: The trendline is usually steep and narrow, with price bouncing quickly out of the channel.
Deep pullback: The channel is wider; price may retest multiple times before reversing sharply.
Complex pullback: The structure often forms flags, wedges, or small channels A breakout from these patterns typically signals a strong entry.
Identifying through Price Action
Price action is the most refined way to read pullbacks and is ideal for traders who prefer not to rely on indicators.
Common price action signals include:
Rejection candles (pin bars): Show opposing pressure from the dominant trend.
Bullish/Bearish engulfing candles: Confirm that the dominant side has regained control.
Break of structure (BoS): When price breaks a recent swing high/low, signaling the end of a pullback.
Trading strategies for different pullback types

Understanding the kind of pullback the market is experiencing is just the first step; the actual secret to success is to trade each sort of pullback appropriately. Below are specific strategies to help you optimize your entry, exit, and risk management for every kind of pullback.
Strategy for Shallow Pullback
A strong trend with only slight retracement signaling that buyers or sellers still have full control.
How to trade it:
- Confirm the trend: Use EMA 9/20 or a higher time frame to ensure the main trend remains strong.
- Identify entry signals: Look for reversal candles such as a bullish engulfing (in an uptrend) or bearish pin bar (in a downtrend).
- Enter the trade: Once a confirmation candle aligns with the main trend direction.
- Stop loss: Place it just below the nearest swing low (or above the swing high in a downtrend).
- Take profit: Aim for an R:R ratio of 1:2 or the next resistance/support zone.
Strategy for Deep Pullback
A stronger correction that typically tests key support zones or the Fibonacci 50–61.8% retracement levels.
How to trade it:
- Step 1: Identify confluence zones (support/resistance + Fibonacci + trendline).
- Step 2: Wait for confirmation such as a hammer, doji, or break of structure (BoS).
- Step 3: Enter once the price confirms the reversal beyond the signal candle or structure break.
- Stop loss: Set outside the support/resistance zone (around 10–20 pips depending on the time frame).
- Take profit: Target an R:R ratio of 1:2 or the next swing level.
Strategy for Complex Pullback
The price retraces in multiple smaller waves, forming consolidation patterns like a flag, channel, or wedge.
How to trade it:
- Identify the structure: Draw upper and lower trendlines around the pullback zone.
- Monitor volume: Volume typically declines during the consolidation phase.
- Entry: Enter when the price breaks out of the pattern in the direction of the main trend, preferably with a retest confirmation.
- Stop loss: Place it outside the structure (above the flag’s top or below the wedge’s bottom).
- Take profit: Measure the height of the pattern (from low to high) and project it from the breakout point.
Risk Management in Pullback Trading
Regardless of the type of pullback, risk management remains the foundation of consistent success:
- Limit risk per trade to 1–2% of total capital.
- Define an invalid zone. If the price breaks beyond it, exit immediately.
- Avoid duplicate entries. Take only one high-quality entry per trend.
- Always use a stop loss; never rely on hope in volatile conditions.
Common mistakes when trading pullbacks
Below are the most common mistakes traders make when trading different types of pullback.
Entering too early, no confirmation signal
Many traders see a small retracement in an uptrend and immediately assume it’s a pullback, entering long too soon, but the market might actually be preparing for a full reversal.
Result: Entering at the wrong time, getting stopped out, or being caught in the opposite trend.
Confusing pullback with reversal
This is the most common mistake. A pullback is a temporary correction, while a reversal is a complete change of trend. Inexperienced traders often confuse the two because they fail to check the higher timeframe structure.
Trading against the main trend
Some traders try to “catch tops or bottoms” during a pullback for quick profits, a highly risky move, especially in strong trends.
Ignoring confirmation tools
Another common mistake is entering trades based solely on intuition without confirming with indicators or price structure.
Poor risk management
Even if you identify the correct type of pullback, trading with oversized positions or without a stop loss can still wipe out your account if the market moves against you.
Lacking patience, entering before the pullback completes
Many traders “chase” the trend without waiting for the pullback to finish, causing them to enter right at temporary highs or lows.
Conclusion
Types of pullback are a fundamental concept in every trend-following trading strategy. Understanding each type, from shallow retracements in strong trends to extended complex corrections, helps you distinguish between a continuation signal and an early sign of reversal. When you truly understand the behavior of each pullback type and trade them with discipline, you’ll move one step closer to a consistent and sustainable trading style.
Follow the Knowledge Hub section to stay updated with more valuable market insights and trading knowledge.


