In the volatile world of finance, identifying market trends is crucial for effective trading. The trend trading method has become a popular choice due to its ability to help traders follow the main flow of price movement. This approach not only reduces market noise but also optimizes entry points.
The trend trading method works by analyzing whether the market is in an uptrend or downtrend, allowing traders to choose appropriate positions. In an uptrend, traders prioritize buying with the price momentum, while in a downtrend, selling with the downward movement provides a strategic advantage.
Trend traders use various technical tools, including moving averages (MA), trend lines, and momentum indicators, to capture market direction. By analyzing charts and recognizing price patterns, they identify support and resistance levels to optimize entry and exit points.
Once a trend is identified, traders typically trade in the direction of the price movement, aiming to ride the trend as long as possible. This means opening long positions when an uptrend is established and opening short positions during strong downtrends to leverage the market’s natural momentum.
Various categories of market trends
Various categories of market trends
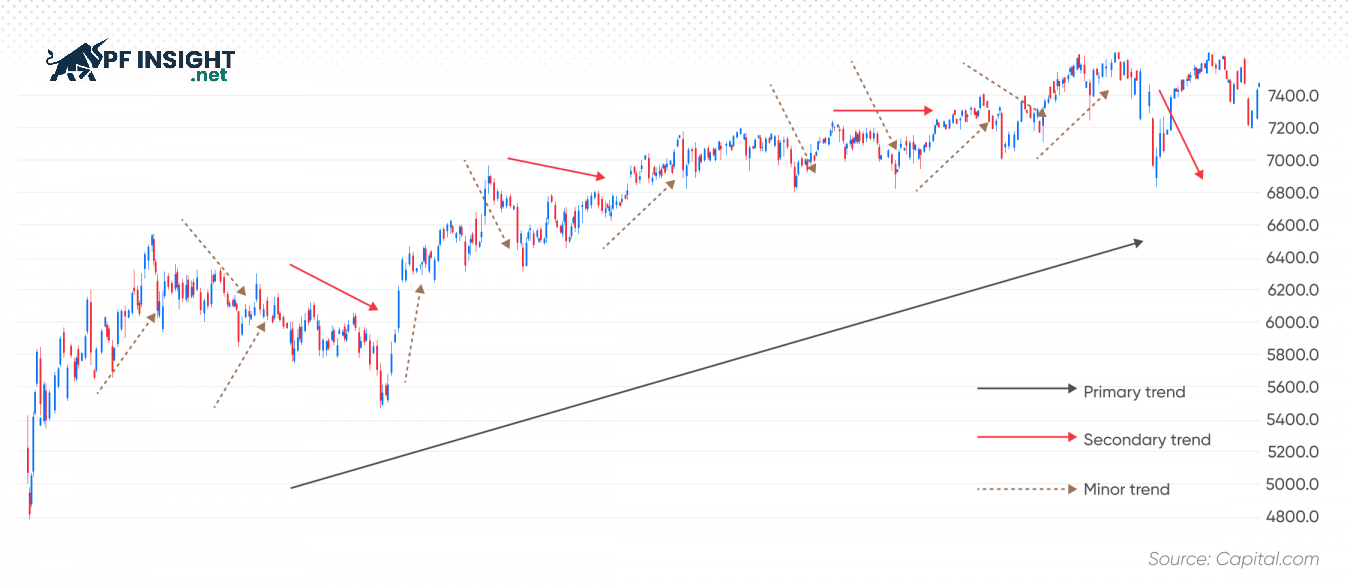
Trend traders should understand different types of trends to apply strategies effectively:
Secular trends: Long-term trends lasting several years or even decades, often driven by major structural changes in the economy or broad demographic shifts.
Primary trends: Medium-term price movements lasting several months to a few years, typically caused by economic cycles or political and financial events.
Secondary trends: Short-term movements lasting a few weeks to a few months, often influenced by investor sentiment or technical signals.
Intermediate trends: Short-term trends lasting several days to a few weeks, usually caused by changes in supply and demand or abnormal market volatility.
Minor trends: Very short-term trends lasting only a few days, suitable for day traders or short-term trend followers, often influenced by news or market activity levels.
How to distinguish when a trend starts and ends?
How to distinguish when a trend starts and ends?
For a new trend
A common method is to use trend lines drawn according to price movements on the chart. Trends can be classified into three categories: uptrend, downtrend, and sideways trend.
Uptrend: Connect the two most recent lows. If the line slopes upward and prices form higher highs and higher lows, an uptrend is confirmed. Traders will prioritize buying along the market momentum.
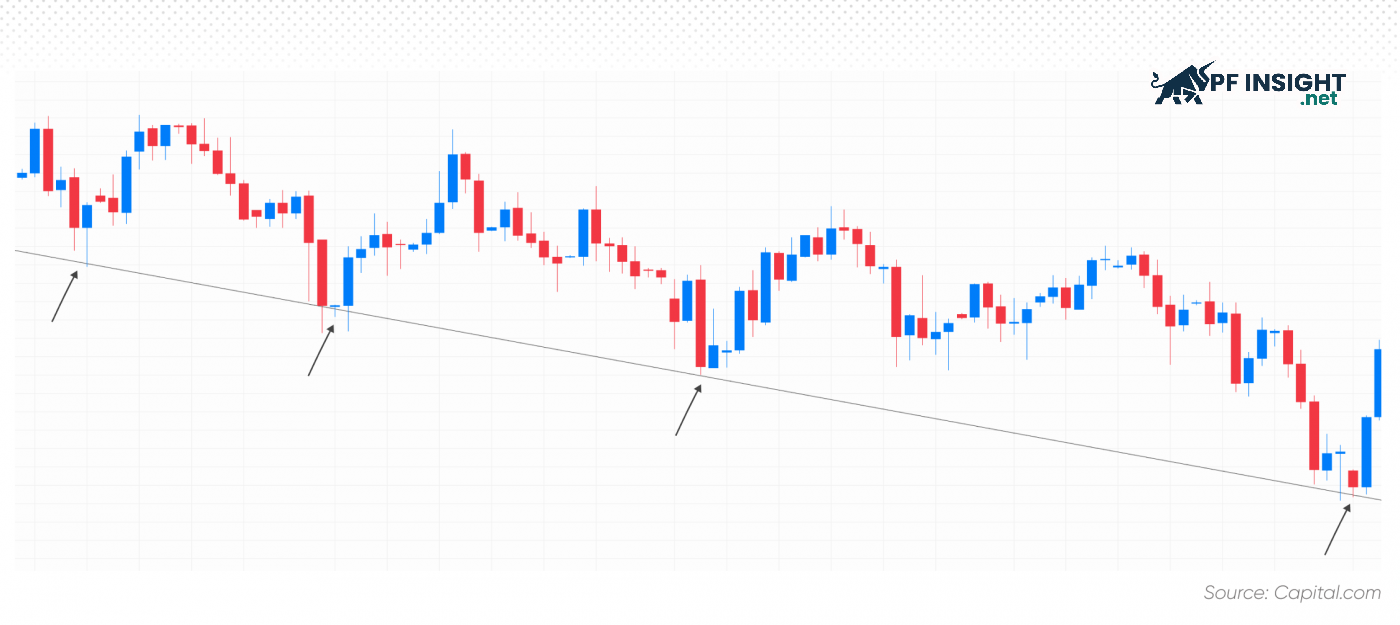
Downtrend: Connect two recent highs. A downward slope indicates lower highs and lower lows, suggesting traders should consider short-selling to follow the declining trend.
Sideways trend: When highs and lows form a horizontal line, the market is in a sideways or consolidation phase. Traders can buy near support and sell near resistance to exploit small price fluctuations.
For trend endings
One common way in the Trend trading method is to observe reversals. When price begins moving opposite to the main trend and sustains this movement, particularly near support or resistance, the previous trend may have ended.
Ensure that the market is truly reversing and not just experiencing a temporary pullback, as misjudging this may lead to premature exits. Tools like Fibonacci retracements can help evaluate whether the price is merely correcting or changing trend.
Always set exit orders for all positions, including take-profit and stop-loss, so accounts are automatically protected when the price reaches target levels. Risk management is a crucial component, equally important as entry and exit strategy.
Common indicators in the trend trading method
With the Trend trading method, traders can flexibly apply multiple techniques simultaneously to optimize trading efficiency. Combining trend-following strategies helps capture market momentum while minimizing risks during volatile periods. Depending on personal style and risk tolerance, each trader can select the most suitable set of methods to gain a competitive edge.
Moving Averages (MA)
Moving averages (MAs) calculate the average price of a financial instrument over a specific period of time.
MAs calculate the average price of a financial instrument over a specific period. Common choices include 9, 14, 50, or 200 days, but parameters can be adjusted to suit one’s analysis and strategy.
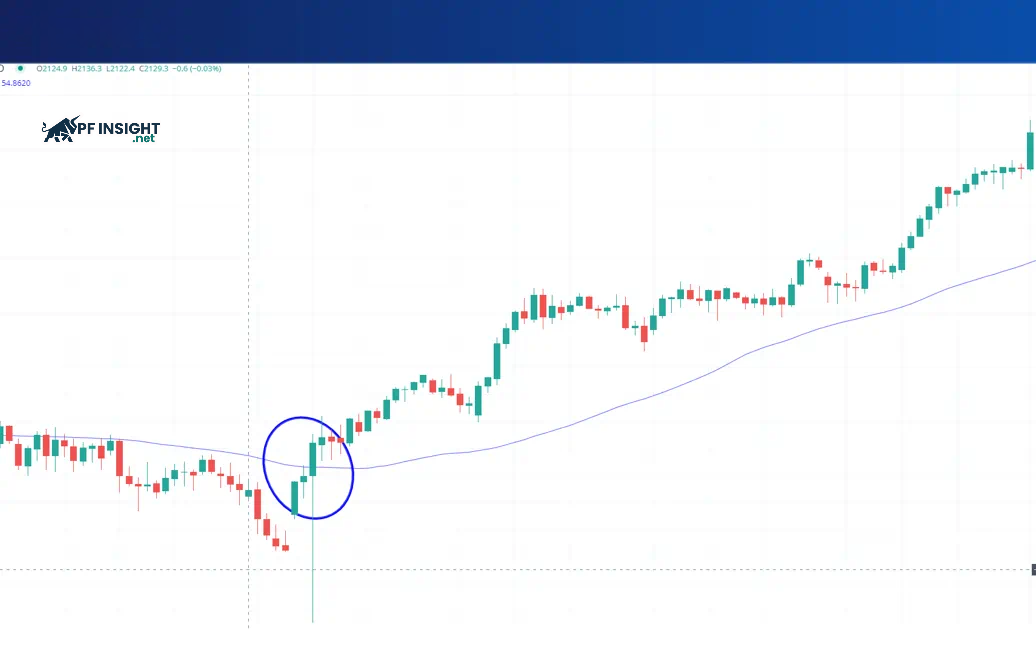
When applying MA in the Trend trading method, observe the price relative to the MA. If the price is below the MA, the market may prepare for a bullish reversal. Conversely, if the price is above the MA, watch for a possible downward reversal, signaling the start of a bearish trend.
Trend lines
Trend lines are drawn by connecting significant highs or lows
Trend lines are drawn by connecting significant highs or lows, forming straight lines that clearly indicate market direction and trend slope. They help traders understand overall price movement.
Trend lines are not only useful for identifying trends but also for finding entry points when combined with candlestick patterns and technical indicators. For example, spotting a bullish reversal pattern, such as a double bottom, near an upward trend line reinforces the signal that buyers are in control, creating an opportunity for trend-following trades.
Relative Strength Index (RSI)
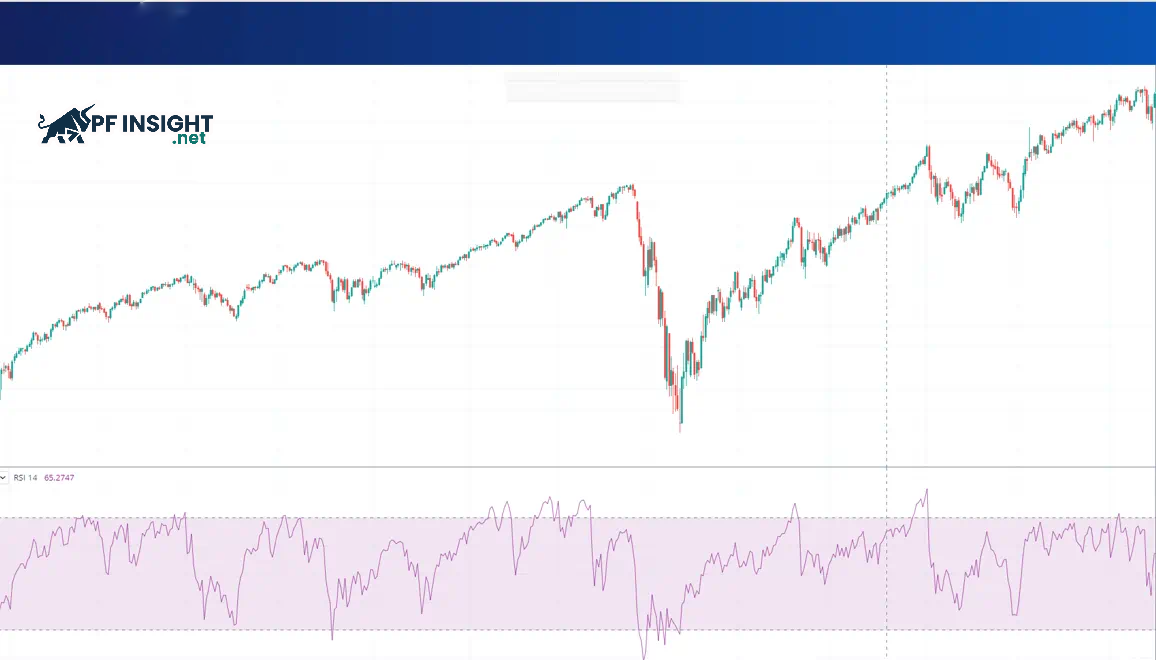
This indicator reflects the strength or weakness of the current trend
The RSI is an effective momentum tool, particularly useful in the trend trading method. This indicator reflects the strength or weakness of the current trend, helping traders determine whether the trend is likely to continue or losing momentum. When momentum decreases significantly, RSI can signal a potential reversal.
RSI measures buying and selling pressure by calculating the ratio of up periods to down periods. Its values range from 1 to 100, allowing traders to assess market strength at a given time.
When RSI falls below 30, the market is considered oversold. This signals a potential reversal, as many traders view this as a buying opportunity when the price is attractive.
When RSI rises above 70, the market is considered overbought. This indicates that buying pressure has weakened and sellers may gain control, increasing the likelihood of a downward reversal.
Bollinger Bands
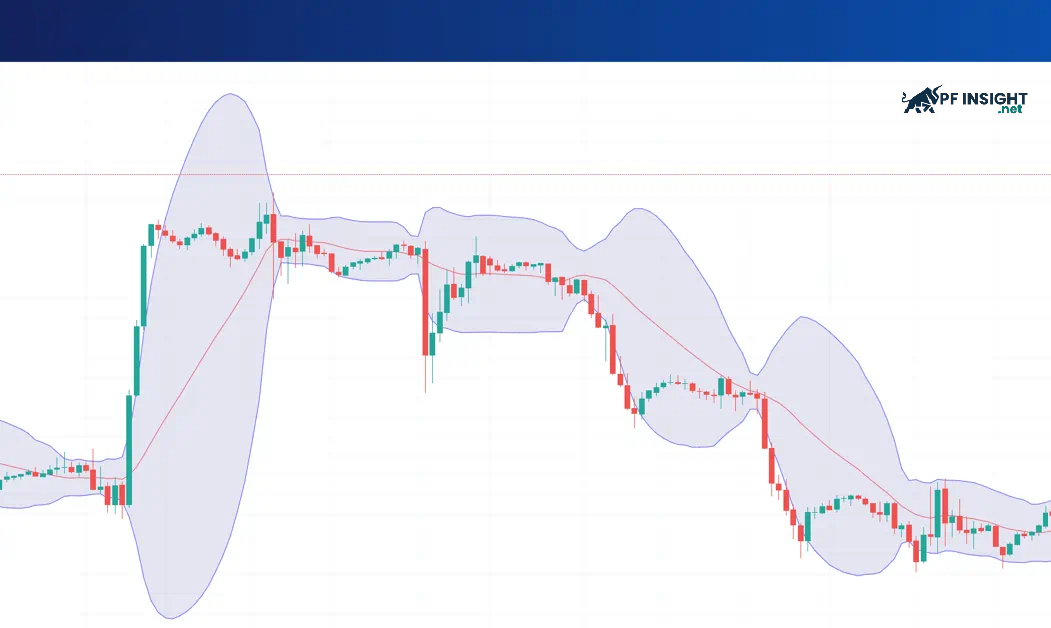
Bollinger Bands are a popular technical tool used to identify overbought and oversold areas.
Bollinger Bands are a popular technical tool used to identify overbought and oversold areas. The indicator consists of three lines:
Middle band: 20-day SMA
Upper band: SMA plus two standard deviations
Lower band: SMA minus two standard deviations
Bollinger Bands provide a clear view of volatility in the Trend trading method. When the price drops below the lower band, it signals an oversold condition in a downtrend and the market may rebound, forming a new uptrend.
When the price breaks above the upper Bollinger Band, the market is usually overbought and may reverse downward. For example, a chart may show price reaching an overbought area, moving beyond the upper band, and then reversing into a downtrend.
Average Directional Index (ADX)
This trend trading tool measures the strength of a market trend. Like RSI, it uses a scale up to 100, where higher values indicate stronger momentum and a trend likely to continue.
ADX is one of three components of the system, alongside the DI+ and DI- lines. ADX shows trend strength, while the DI lines indicate whether the trend is upward or downward, giving traders a more comprehensive view.
An ADX above 25 indicates a strong trend, while a value below 20 suggests the market lacks momentum and no clear trend is forming.
Thanks to complex calculations, this technical tool is considered a reliable indicator for accurately measuring the strength of ongoing trends.
4 trend trading methods for beginners
Although the Trend trading method is an independent strategy, traders often combine it with other approaches depending on market context and trend type. Regardless of the strategy, having a clear risk management plan is essential.
4 trend trading methods for beginners
Breakout trading
In markets moving strongly in one direction, breakout trading is highly effective. Traders identify familiar support and resistance levels where price previously reversed. Observing momentum near these levels is crucial. If price breaks these levels with strong force, a new trend is likely forming.
Retracement trading
Retracement trading works best in moderately trending markets that are not too strong but still clear. Price often experiences pullbacks, providing opportunities to enter positions at more favorable levels. As the trend continues, profits can expand. Traders must ensure these are temporary adjustments, not reversals, and always set stop-loss orders.
Range trading
Range trading occurs when the market lacks momentum, creating weak trends and moving sideways. Traders using the Trend trading method leverage clear support and resistance levels to find entry and exit points. For long positions, enter near support and exit near resistance. For short positions, enter at resistance and exit near support. This strategy requires patience and strict risk management.
News trading
News-based trading focuses on fundamental factors such as company earnings, economic data, and breaking news. These can alter market expectations and significantly affect asset prices.
For example, if a company reports profits for four consecutive quarters, you may expect the stock to continue rising as long as earnings remain stable. When the company releases a positive Q4 report, you might decide to buy to capitalize on the trend.
You may hold the position until the company reports negative earnings, which could take months or even years. This strategy relies mainly on fundamental analysis, making it suitable for investors less interested in technical analysis. However, confirming signals with other indicators or tools is still useful for risk reduction.
Tips to optimize trend trading
Tips to optimize trend trading
Here are key points for using the trend trading method:
Combine indicators to identify trends: Using multiple technical indicators helps evaluate market momentum accurately. When indicators agree, trend signals become more reliable, allowing early entry before the market reverses.
Suitable for medium and long-term strategies: Trend trading works best on longer timeframes, but it can adapt to any timeframe depending on trend duration if market structure is identified correctly.
Three main market states: Price can move upward, downward, or sideways. Correctly identifying the state helps choose the right strategy.
Supporting tools for trend trading: Common tools include RSI for momentum, MA for trend direction, and ADX for trend strength.
Always prepare a capital protection plan: Regardless of trend clarity, risk management is essential. Set backup plans to prevent large losses from sudden market movements.
Test multiple methods to find your style: Experiment with different strategies to see which suits your psychology and goals. Beginners should start with a demo account to limit risk.
Awareness of sideways market behavior: The market spends much time in a sideways state. Without understanding accumulation and distribution phases, avoid short-term trend trading due to high noise and risk.
Frequency of touching support/resistance and trend durability: Frequent price contact with support or resistance while maintaining movement direction indicates a strong, stable trend and reliable trading opportunities.
Sudden price moves and reversal likelihood: Sharp price increases or decreases raise the chance of trend reversal. Conversely, flat, even price movement usually signals a long-term, sustainable trend.
Conclusion
Using the trend trading method provides opportunities to capture long-term trends and maximize profits. PF Insight advises traders to combine technical analysis with risk management for optimal results. Continuous practice and disciplined adherence to strategies help traders maintain a competitive edge in the market.