In financial markets, price does not move randomly but directly reflects the imbalance between buying and selling pressure at each moment. When supply fails to keep up with demand, or vice versa, the market often produces strong moves and opens up high-probability trading opportunities. Correctly identifying supply demand imbalance zones on the chart allows traders to get ahead of major money flow instead of chasing trends after they have already formed. In this FP Insight article, you will learn how to spot imbalances systematically to build more effective trading setups.
In financial trading, a supply and demand imbalance refers to a market condition where there is a clear mismatch between buying pressure and selling pressure at a specific price zone. When one side overwhelmingly dominates, price is forced to leave that area quickly in search of a new equilibrium level. On the chart, imbalance is usually reflected by strong impulsive candles with very little consolidation in between. These areas reveal where large capital entered aggressively, leaving behind price zones that the market often reacts to again in the future. For this reason, imbalance is considered a core foundation of many modern supply and demand and price action strategies.
Why imbalance causes strong price moves
Strong price movements occur when the volume of buy or sell orders far exceeds the market’s ability to absorb them. When buyers keep executing orders without sufficient supply, price is pushed upward rapidly to find new sellers, and the opposite happens when selling pressure dominates. Large institutions often create imbalance when they enter sizable positions within a short period of time. This prevents the market from building consolidation and results in clear breakouts or impulsive moves. These imbalance phases are what form high-probability reaction zones when price later returns to test them.
Difference between imbalance and normal consolidation
Imbalance and consolidation represent two completely different market states. During consolidation, buying and selling pressure are relatively balanced, causing price to move slowly and often range within a narrow zone. In contrast, imbalance appears when one side takes full control, forcing price to leave the area decisively and quickly. On the chart, consolidation usually shows many small overlapping candles, while imbalance is marked by large-bodied candles with little retracement. Clearly distinguishing between these two conditions helps traders avoid choppy zones and focus on opportunities driven by strong momentum.
Key characteristics of high-probability imbalance zones
Not every imbalance zone offers a good trading opportunity. High-probability setups usually share clear characteristics in how price leaves the supply or demand area and how market structure forms afterward. Learning to filter for quality zones helps traders avoid entering weak areas that are easily broken. Strong imbalances typically reflect decisive participation from large capital rather than scattered, low-commitment trading. Below are the key factors used to identify high-reliability imbalance zones.
Sharp displacement and strong momentum
One of the clearest signs of a quality imbalance is price leaving a consolidation area with speed and wide range. Instead of moving gradually, the market prints consecutive large-bodied candles in one direction. This shows that one side has completely taken control of order flow at that moment. The stronger the displacement, the higher the probability that the imbalance zone will act as a reaction area in the future. Traders should prioritize zones that cause market structure breaks or push through major support and resistance levels.
Low trading volume inside the zone
High-quality imbalance zones usually form very quickly with little trading activity inside the area. On the chart, this appears as only a few candles with almost no retracement before the price breaks away. When the market does not spend time consolidating, it suggests the dominant side encountered minimal opposition. These zones often hold strong reactions when price later returns to test them. In contrast, areas with many overlapping candles typically signal hesitation and lower reliability.
Clean structure and minimal overlap
Strong imbalances tend to appear within a clean and orderly market structure. Price moves in a consistent direction without frequent whipsaws or choppy fluctuations. The candles forming the imbalance zone rarely overlap heavily with previous supply or demand areas. This clarity makes it easier for traders to define entries and place stop losses logically. Structurally clean zones usually reflect intentional action from large money flow, resulting in higher-probability trading opportunities.
How to spot supply demand imbalance on trading charts (step by step)
Rather than searching randomly across the chart, traders should approach imbalance with a clear, structured process. This helps filter out market noise and focus only on zones with high reaction probability. Below is a step-by-step method to identify supply demand imbalance effectively.
Identifying the impulse move
The first step is to locate strong price expansions, usually shown by multiple large-bodied candles moving in the same direction. A high-quality impulse move typically has these characteristics:
Price leaves the consolidation area quickly and decisively
Little to no counter-trend candles during the move
A break of market structure or a key support/resistance level
These explosive moves signal where imbalance is being created.
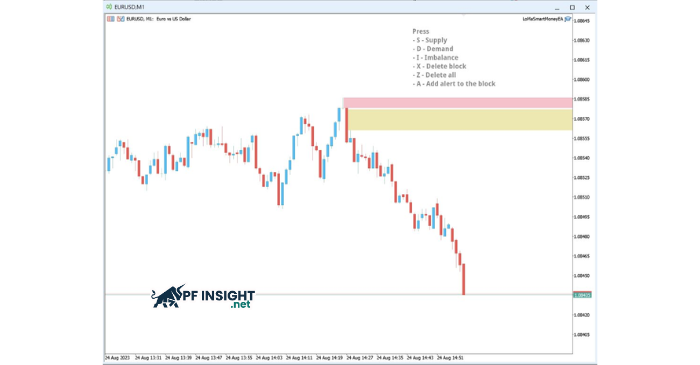
Marking the origin of imbalance
Example of a supply imbalance zone on EUR/USD where strong selling pressure caused a sharp price drop.
Once the impulse move is identified, trace back to where the price initially began its strong push. This area is the origin of the imbalance and usually where large capital entered the market. When marking the zone, focus on:
The final candles before the strong breakout
Areas with minimal consolidation or overlap
A clean price range that allows precise risk management
The cleaner and more compact the zone, the higher its future reaction potential.
Validating fresh vs tested zones
Not all imbalance zones carry the same trading value. An important step is distinguishing between fresh zones and those that have already been tested. Traders should prioritize:
Imbalance zones that price has not yet revisited
Areas with only one touch or no clear reaction yet
Zones that still maintain their original structure
In contrast, zones that have been tested multiple times tend to weaken and are more likely to break.
Best timeframes to trade imbalance zones
Supply demand imbalance manifests differently depending on the timeframe a trader observes. On lower timeframes, zones tend to react quickly but are more easily broken, while on higher timeframes they often act as major price areas that shape broader market movement. Understanding this difference helps traders align imbalance trading with the right style instead of applying one rigid approach to every chart.
Intraday trading setups
In intraday trading, imbalance zones commonly form after sharp breakouts during the London or New York sessions. Price often returns quickly to test these areas before continuing in the main direction. These reactions usually happen fast and provide tight stop-loss entries with attractive risk-to-reward profiles. However, because volatility is constant, not every intraday zone remains valid for long. Traders should always monitor market structure to avoid trading imbalances when momentum is already fading.
Swing trading opportunities
For swing trading, imbalance is used in a more strategic way. Traders typically start from higher timeframes to identify major supply and demand zones, then patiently wait for price to return over days or even weeks. These zones often align with major trend turning points or continuation areas. Instead of chasing quick reactions, swing traders focus on larger price moves and higher reward potential per trade. This approach reduces screen time and helps limit overtrading while staying aligned with higher-probability market flows.
Common mistakes traders make with imbalance
Even though supply demand imbalance is a powerful tool in price action trading, many traders still struggle because they apply it without proper filtering. The problem is not whether imbalance zones exist, but how traders evaluate their quality within the overall market context. Without a clear selection process, imbalance easily becomes noise instead of a trading edge. The following mistakes are among the most common reasons why many setups fail to deliver consistent results.
Trading every zone blindly
Many traders believe that the more imbalance zones appear, the more trading opportunities they have. In reality, the opposite is usually true. Trading without selectivity often leads to a high loss rate and emotional decision-making. Common issues when trading every zone include:
Entering trades at zones formed by random volatility
Trading against the main market trend
Ignoring weak momentum or overlapping zones
Using wide stop losses because the zone is unclear
Professional traders focus only on a small number of high-quality setups.
Ignoring market structure
Market structure with clear support, resistance, and flip zones guiding high-probability price reactions.
Market structure reveals whether buyers or sellers are in control at each stage of the market. When imbalance aligns with the prevailing trend, price reactions tend to be strong and clean. In contrast, trading imbalance zones against the dominant structure significantly increases failure probability. Observing higher highs and higher lows, or lower highs and lower lows, helps define directional bias. Combining structure with imbalance allows traders to follow institutional flow rather than fight against it.
Real trading examples of high-probability imbalance
Real-world examples help traders clearly understand how supply demand imbalance operates in live market conditions. Observing price reactions at high-quality zones is one of the fastest ways to improve your ability to identify and trade imbalance effectively.
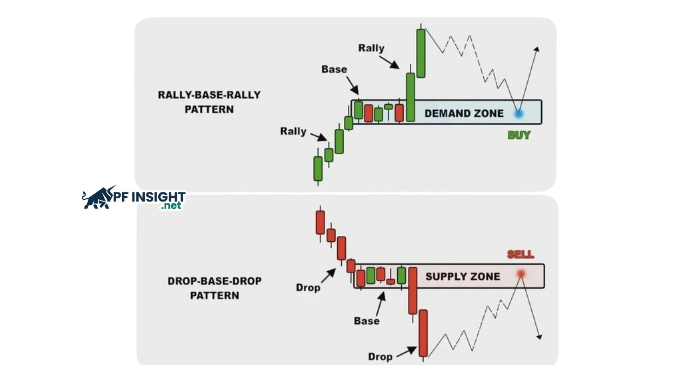
Trend continuation using demand imbalance
Imagine the market is in a strong uptrend with clearly defined higher highs and higher lows. After a powerful breakout above a previous resistance level, price does not continue rising immediately but instead pulls back slowly with weak momentum. At the origin of that strong upward move, a demand imbalance zone has been formed. When price returns to this area, buying pressure quickly re-enters the market and pushes price higher, allowing the trend to resume. Scenarios like this occur repeatedly in well-defined trending markets.
Reversal setups at major supply imbalance zones
Reversal setups typically form with clear structure and can be identified through a shift in price behavior across different phases. When the following signals align, the market often enters a reversal phase with strong momentum:
The market begins to lose momentum after a prolonged trend, with price swings gradually contracting
Selling pressure suddenly emerges through a sharp decline that breaks previous swing lows
A supply imbalance zone forms at the origin of the fastest price drop
Subsequent pullbacks show weak buying pressure and are consistently rejected at the supply zone
Conclusion Supply demand imbalance highlights moments when buying or selling pressure overwhelms the market, creating high-probability price reaction zones. When combined with market structure and strong momentum from impulse moves, these zones allow traders to align with institutional flow instead of trading random noise. Rather than using every imbalance blindly, focusing on clean, fresh zones within the dominant trend leads to more consistent and sustainable trading results.