Smart money liquidity theory explains how large institutions use order flow and retail traders’ stop-loss clusters to generate powerful price movements in the market. Understanding this mechanism allows traders to read price action more accurately instead of relying solely on technical indicators. This article will break down both the theoretical foundation and the practical ways liquidity truly drives price behavior in real trading conditions.
Smart money targets liquidity where the largest concentration of orders exists in the market.
Definition in the institutional trading context
Smart money liquidity theory is a framework that explains how large financial institutions such as banks, hedge funds, and market makers drive price movement by seeking and exploiting liquidity. In institutional trading, liquidity represents clusters of pending buy and sell orders large enough to allow institutions to enter or exit positions without causing excessive slippage. Rather than trading randomly, smart money deliberately moves price toward areas where retail traders’ stop losses and pending orders are concentrated. These liquidity zones become the fuel behind the market’s strongest impulsive moves.
Why liquidity is the real driver of market movement
Every price movement requires opposing order flow to be executed, and liquidity is what provides that flow. When liquidity is thin, price tends to move slowly and erratically. In contrast, areas with heavy order concentration often attract sharp breakouts and sudden spikes. Large institutions cannot deploy hundreds of millions of dollars at a single price level without sufficient counterparties. As a result, they guide the price toward liquidity-rich zones where their positions can be absorbed efficiently. What retail traders often interpret as random volatility is, in reality, the market seeking available liquidity.
Difference between smart money and retail participation
The core difference between smart money and retail traders lies in both intent and market impact. Retail traders typically enter based on common indicators and chart patterns, placing stop losses at highly predictable levels. Smart money, on the other hand, targets these very stop-loss clusters as sources of liquidity for large-scale execution. While retail traders react to price movement after it occurs, institutions are the ones creating those movements by directing price toward liquidity pools.
Why price moves toward liquidity, not indicators
Order flow mechanics explained simply
Every transaction in the market is formed through the matching of buyers and sellers, and this process is known as order flow. Price can only move when sufficient opposing orders are continuously executed at new price levels. Technical indicators merely analyze historical price data and do not generate any real buying or selling pressure. Order flow, by contrast, reflects actual supply and demand in real time, while liquidity provides the environment that allows large orders to be absorbed efficiently.
How stop losses and breakout traders create liquidity pools
The common behavior of retail traders unintentionally creates large liquidity zones that smart money actively seeks. Major sources of liquidity formation typically include:
Stop losses placed at previous highs, lows, and obvious support and resistance levels
Breakout orders triggered when price breaks consolidation ranges or trendlines
Pending buy and sell orders around key psychological price levels
Clusters of orders built during prolonged sideways market conditions
When many orders are waiting to be triggered in the same area, the market forms liquidity pool zones that price is naturally drawn toward before initiating major directional moves.
Why markets seek areas of high resting orders
Price tends to gravitate toward regions containing large concentrations of resting orders because these zones provide the necessary liquidity for institutional-scale execution. Such areas commonly form around technical confluence levels, major swing highs and lows, or extended accumulation ranges. When price enters these regions, the simultaneous activation of orders rapidly increases volatility, leading to stop hunts, false breakouts, and sharp reversals. This mechanism sits at the core of most price movements traders observe each day.
Where liquidity forms on price charts
Liquidity does not form randomly. It tends to concentrate around price areas where large numbers of traders make similar decisions. On charts, these are usually obvious technical zones that are easy to identify and widely watched by the market. Smart money understands this behavior and frequently drives price toward these areas to collect the order flow needed before initiating the real directional move.
Equal highs and equal lows
Equal highs and equal lows are classic areas where retail traders place stop losses or prepare breakout trades. As price approaches these levels, large clusters of resting orders build just above highs or below lows. This concentration turns equal highs and lows into highly attractive liquidity pools for institutional players. Price often sweeps through these levels briefly before reversing or accelerating in a new direction.
Previous session highs and lows
The highs and lows of the previous trading session are key reference points watched by many traders. They are commonly used for stop placement, profit targets, and intraday entries. When price returns to these levels, liquidity typically increases sharply as multiple orders trigger simultaneously. For this reason, institutions frequently target prior session highs and lows as natural liquidity objectives.
Consolidation ranges and trendline breaks
Sideways market phases create accumulation ranges where traders repeatedly enter and exit within a narrow price band. Over time, stop losses build above and below the range boundaries, forming clear liquidity clusters. Similarly, major trendlines attract breakout traders and trend followers defending positions. When these areas are breached, a wave of orders is triggered at once, often producing a liquidity sweep before price commits to its true directional move.
How smart money uses liquidity to engineer price movements
Smart money does not enter the market impulsively. Every major price movement is carefully prepared through liquidity control. Before strong breakouts occur, the market often goes through phases that appear “normal” to retail traders, while institutions are quietly building positions behind the scenes.
Liquidity buildup and inducement
At many points, price moves slowly, oscillates within a tight range, or continues drifting gently in the existing trend direction. This creates a sense of comfort for retail traders, encouraging repeated entries with the expectation that the market will keep behaving the same way.
As participation increases, stop losses and pending orders naturally accumulate around familiar technical levels.
Smart money does not rush to act during this phase. Instead, institutions allow the market to “grow” liquidity organically until there is sufficient order flow to execute large positions efficiently without causing excessive price distortion.
Stop hunts and liquidity sweeps
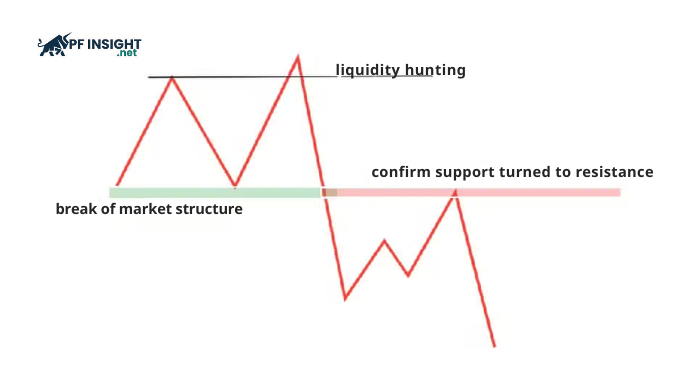
Example of a liquidity sweep followed by a market structure break and resistance confirmation.
Once sufficient liquidity has been built, price often makes fast, aggressive moves through key technical levels. These actions are designed to trigger stop losses and pending orders, providing the order flow smart money needs to complete large entries or exits.
Common characteristics of liquidity sweeps include:
Price quickly runs through obvious highs or lows and then reverses sharply
Candles with long wicks showing mass stop activation
Sudden volatility spikes within a short time window
Multiple traders being stopped out simultaneously
To inexperienced traders, these moves often look like genuine breakouts. In reality, they are usually liquidity collection phases that precede the true directional move.
Market structure shift and price expansion
After the liquidity collection phase is complete, price behavior typically changes in a clear and noticeable way. Pullbacks become weaker, the previous structure is broken, and the market begins forming a new sequence of highs and lows in a defined direction.
At this stage, price action becomes cleaner, less noisy, and moves with greater momentum compared to the accumulation phase. This is the phase where smart money is already positioned and allows price to expand in the intended direction and where liquidity-based traders often find the highest-probability trade opportunities.
Common liquidity-driven price action patterns
Once liquidity has been collected, the market rarely stays stagnant. What follows tends to repeat in recognizable price behaviors that appear across nearly all timeframes. Being able to identify these patterns helps traders distinguish between stop hunts and the beginning of genuine market moves.
False breakouts followed by reversals
One of the most common expressions of a liquidity sweep occurs when price clearly breaks a support or resistance level and then quickly reverses. In that moment, breakout traders enter in the direction of the move, while stop losses from traders holding the opposite side are triggered simultaneously.
Once this flow of orders is absorbed, price often snaps back aggressively, leaving many participants trapped on the wrong side of the market. On the chart, this pattern typically appears as long wicks or sharp spikes clear signs that liquidity has just been swept.
Trend acceleration after a liquidity grab
Not every liquidity sweep leads to a reversal. In many cases, the market only briefly runs stops to gather additional orders before continuing in the primary trend direction.
After the sweep, price often pulls back very shallowly or not at all and then accelerates strongly in the original direction. This is when market structure becomes cleaner, moves extend further, and noise decreases. For smart money traders, this phase often delivers the best risk-to-reward opportunities.
Sharp displacement moves
At times, once liquidity is collected, the market does not progress gradually but instead produces an immediate and powerful displacement. Large consecutive candles drive price through multiple key levels in a short period of time.
These moves reflect a strong imbalance between supply and demand after large orders are executed. They often mark the start of a new trend or the clear end of a prior consolidation phase. For traders applying liquidity theory, displacement signals that smart money has completed its positioning and is allowing price to expand with intent.
How traders can apply smart money liquidity theory in real trading
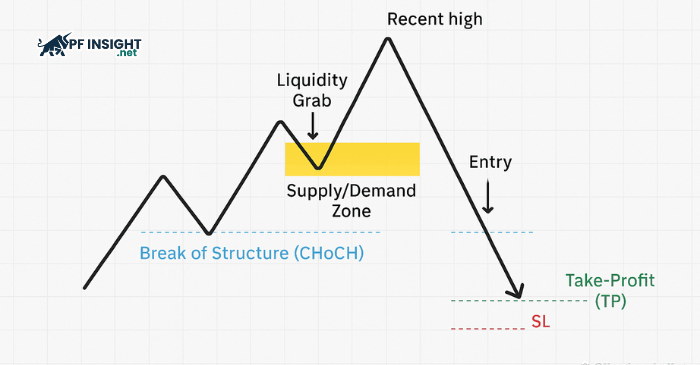
Smart money liquidity grab followed by break of structure and high-probability trade entry.
Smart money liquidity theory is not just a conceptual framework it can be applied directly to everyday trading decisions. By focusing on liquidity, traders shift from trying to predict price to patiently allowing the market to move into high-probability areas.
Identifying high-probability liquidity zones
High-quality liquidity areas usually display one or more of the following characteristics:
Clear swing highs and lows that have been tested multiple times
Previous session highs and lows from the Asian, London, or New York sessions
Extended consolidation ranges before strong breakouts
Confluence zones of support, resistance, and trendlines
The more technical factors that align, the higher the likelihood that a liquidity pool exists in that area.
Timing entries after liquidity sweeps
Smart money traders wait for proof that liquidity has already been collected rather than jumping in when the price first breaks a critical level. Compared to typical breakout trades, these indications frequently indicate far higher-probability entries:
The price quickly rebounds after passing through a technical level.
At the sweep zone, long wicks develop.
Changes in market structure over shorter periods of time
The new course gains significant momentum.
Risk management around institutional levels
Risk management in liquidity-based trading focuses on placing stop losses in areas where smart money is unlikely to return for another sweep. Instead of positioning stops too close to obvious technical levels, traders typically place them beyond the liquidity zone that has already been collected. This approach not only helps avoid common stop-hunt moves but also allows for stronger risk-to-reward ratios once the market begins expanding in the intended direction.
Mistakes traders make when trading without liquidity context
When traders do not understand the role of liquidity, they often end up trading against how the market actually operates. Instead of moving with institutional order flow, they react late to price and repeatedly get caught in movements designed to collect orders.
Chasing breakouts
One of the most common mistakes is entering trades immediately when price breaks obvious highs or lows. Traders assume a new trend has started, but in reality this is often just a short-term liquidity sweep.
This behavior commonly results in:
Entering right before the market reverses
Getting stopped out quickly after sharp spikes
Being trapped in repeated false breakouts
Overusing indicators
Many traders stack multiple indicators to “confirm” signals, but most of these tools are based on historical price data. When the market moves to collect liquidity, indicators typically react late or generate delayed signals.
This often causes traders to:
Enter after the main move has already occurred
Exit too early due to noisy signals
Miss the broader institutional flow context
Ignoring stop placement logic
Without understanding liquidity, traders tend to place stop losses in highly predictable locations exactly where smart money usually targets first. Common mistakes include:
Placing stops directly below obvious lows or above clear highs
Ignoring nearby liquidity pools around the entry zone
Getting stopped out repeatedly before the market moves in the intended direction
Key takeaways: using liquidity to read price more accurately
Liquidity acts as the key that unlocks accurate price reading in smart money trading.
Focus on identifying liquidity zones around obvious highs and lows, consolidation ranges, and previous session highs and lows instead of relying on indicator signals.
Understand that strong breakouts are often designed to collect orders and liquidity, not necessarily to start a new trend.
Wait for price reaction after a liquidity sweep before looking for high-probability trade entries.
Observe market structure shifts to confirm when smart money has completed liquidity accumulation and directional control has changed.
Place stop losses beyond predictable technical levels to avoid unnecessary stop hunts.
Manage risk by targeting the next likely liquidity zone where price is expected to move.
Conclusion
Smart money liquidity theory shows that price moves with intention around liquidity zones rather than randomly or because of technical indicators. When traders understand how liquidity forms and is exploited, price action becomes clearer and higher probability. Applying this mindset improves entry timing, risk management, and long-term trading consistency. To deepen your trading knowledge further, explore more real-market analysis and educational content at Pfinsight.net.