In technical analysis, the RSI divergence is a powerful tool that helps traders detect early signals of price reversals. When the RSI indicator does not align with the price trend, it signals a potential change in market momentum, helping traders make more accurate entry decisions and reduce the risk of losses.
RSI divergence is a technical analysis tool that helps traders identify potential market reversals. By comparing price movements to the Relative Strength Index (RSI), traders can assess buying and selling pressure. The RSI fluctuates from 0–100, typically below 30 indicating oversold conditions and above 70 indicating overbought conditions, thus helping to predict effective entry and exit points for trades.
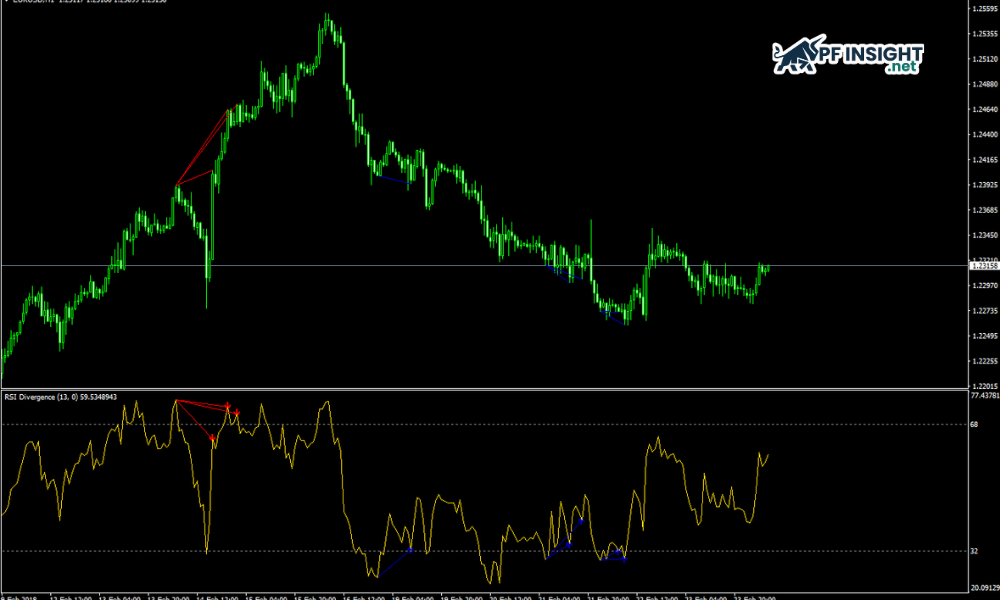
RSI divergence occurs when the price trend and the RSI indicator move in opposite directions, signaling a potential reversal. When the price rises but the RSI falls, the uptrend is weakening; conversely, when the price falls but the RSI rises, the downtrend is showing signs of losing momentum. Investors often use RSI divergence to identify potential entry and exit points, helping them manage risk more effectively.
Common types of RSI divergence
RSI divergence consists of three types: bullish, bearish, and hidden, used to analyze market volatility. Each type provides a unique indication of the current trend’s strength, thereby predicting the likelihood of a price reversal or continuation.
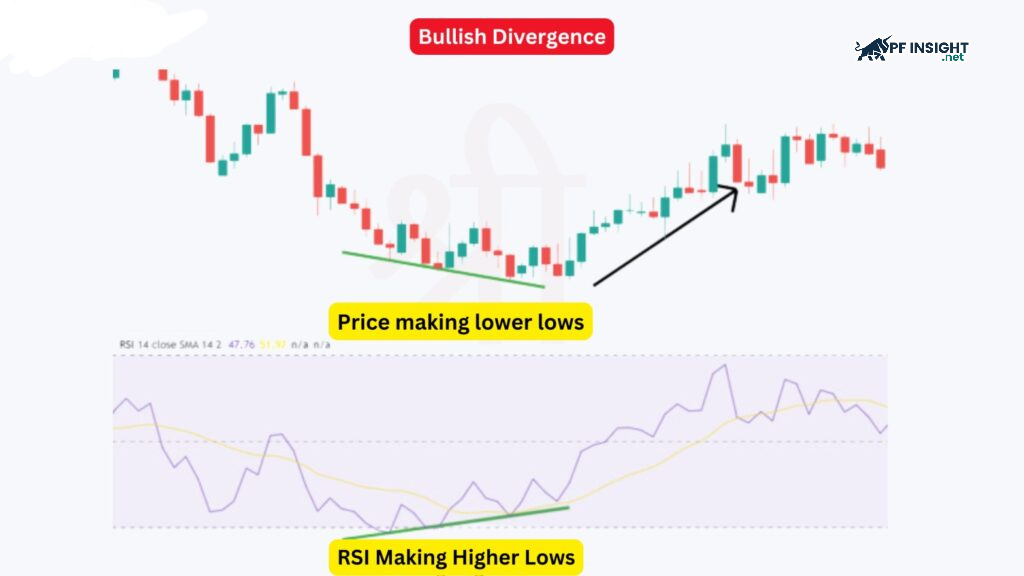
Bullish RSI divergence
Bullish RSI divergence
Bullish divergence occurs when the price creates lower lows while the RSI forms higher lows. This often happens when the RSI is below 30, signaling that the asset is oversold. Even though the price continues to fall, the RSI indicates decreasing selling pressure, suggesting a potential early reversal. This is a strong signal that helps traders predict an upcoming uptrend and find optimal entry points to maximize profits.
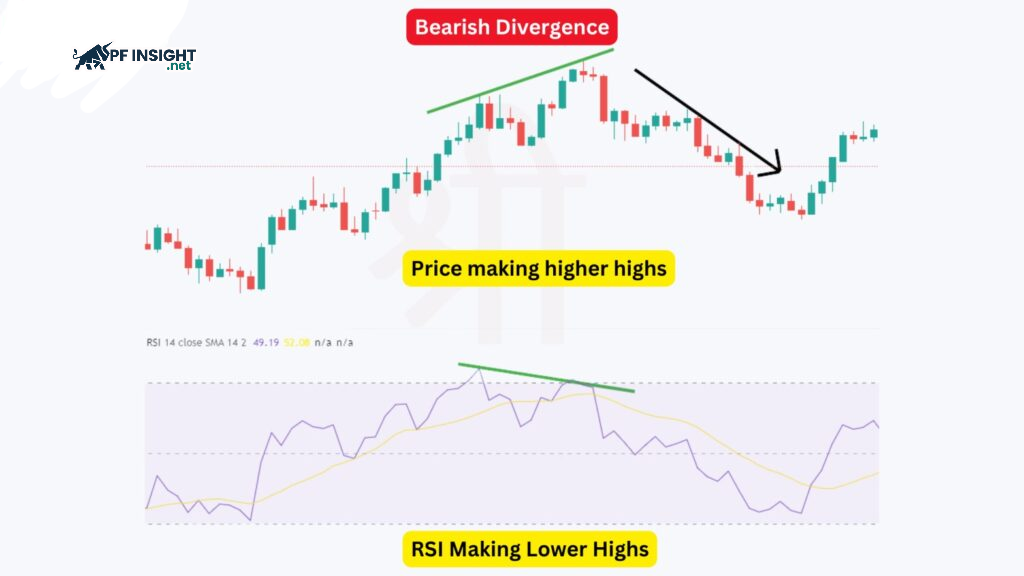
Bearish RSI divergence
Bearish RSI divergence
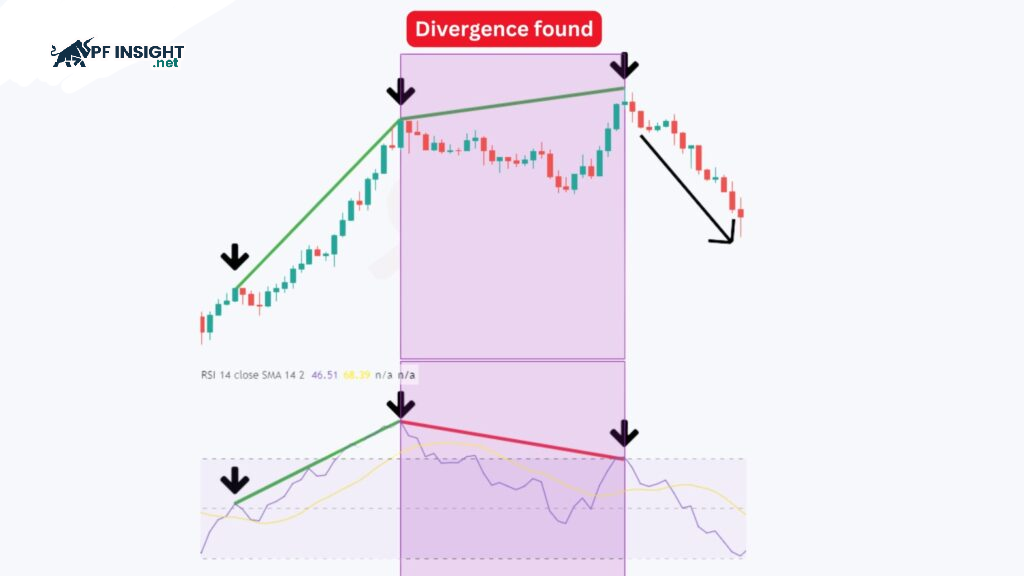
Bearish divergence occurs when the price consistently creates higher highs, but the RSI forms lower highs, usually above 70, indicating that the asset is overbought. Even though the price continues to rise, the RSI signals decreasing buying pressure. This is an early sign that the uptrend may be weakening and a bearish reversal is imminent.
Hidden RSI divergence
Unlike typical divergence, hidden divergence indicates that the trend will continue. Hidden bullish divergence occurs when the price lows but the RSI lows, signaling that buying pressure remains strong. Hidden bearish divergence occurs when the price highs but the RSI highs, suggesting that the downtrend is not over and the decline continues.
Hidden divergence signals that the current trend will continue. They typically appear when the RSI is around 30 for hidden bullish and 70 for hidden bearish, helping traders recognize that market momentum remains strong and there is no reversal.
How to identify RSI divergence on charts
How to identify bullish RSI divergence
A bullish divergence signal from the RSI indicates that the market may be shifting from a downtrend to an uptrend. The following are detailed steps to help you identify and use this signal accurately.
How to identify bullish RSI divergence
Step 1: Observe consecutive lower lows to determine a downtrend
Observe the market to identify lower lows or downtrends. These lows don’t need to be long; even short dips or sideways movements are sufficient. This is the first sign that helps traders detect the potential formation of bullish divergence.
Step 2: Check the RSI at the lowest price level on the chart
Once you’ve identified the lowest price point, observe the RSI indicator. It’s crucial to note whether the RSI behaves inversely to the price. In bullish divergence, the RSI typically forms higher lows while the price continues to form lower lows, signaling a potential bullish reversal.
Step 3: Connect the lows on both the price chart and the RSI
Use trend lines to connect consecutive lows on both price and RSI. Draw separate lines connecting the price lows and RSI lows. You can choose red for the price chart line and green for the RSI line to more easily identify divergences.
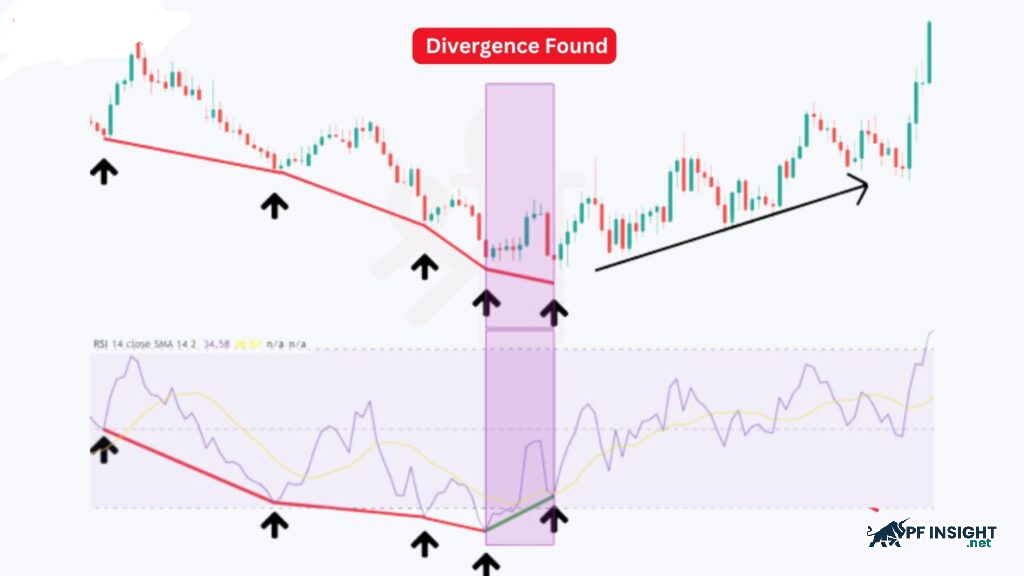
Step 4: Determine potential divergence points
Next, look for divergence on the chart. When the downward price trend line creates lower lows but the upward RSI trend line creates higher lows, this is bullish divergence. This mismatch signals decreasing selling pressure and the possibility of a price reversal to an upward trend.
How to identify bearish RSI divergence
A bearish divergence in the RSI signals that the uptrend is weakening, with the possibility of an upcoming price reversal. Below are the steps to help you identify this signal on the chart.
How to identify bearish RSI divergence
Step 1: Check for consecutive highs to recognize an uptrend
To identify bearish divergence, look for consecutive highs within a price increase. It doesn’t necessarily have to be a long-term trend; just a few close highs are enough to start observing potential reversal signals.
Step 2: Observe the RSI value at each price
Next, check the RSI at price peaks. When the price reaches new highs but the RSI is lower than the previous peaks, this indicates weak buying pressure and warns of a potential price correction.
Step 3: Draw lines connecting the peaks on both the price chart and the RSI
Next, draw trend lines connecting the peaks on both the price chart and the RSI indicator. To clearly identify divergence, use green to connect progressively higher price peaks and red for progressively lower peaks on the RSI. Using these contrasting colors makes it easier to observe the discrepancy between price and market momentum.
Step 4: Identify the divergence signal between price and RSI
A bearish RSI divergence occurs when the price trend line is trending upwards (higher peaks) but the RSI is trending downwards (lower peaks). This signal indicates that upward momentum is weakening. When price and the indicator are out of sync like this, the market is usually preparing for a correction or a downward reversal in the near future.
Maximize profits with an RSI divergence trading strategy
To optimize RSI divergence, incorporate support, resistance, or trend lines. Using additional chart patterns helps confirm the signal accurately and significantly reduces risk.
The core principle of this method is to buy at support levels and sell at resistance levels. However, to trade effectively, traders need to accurately identify these key price levels.
Support level: This is an area where the price is lower than the current price, where buyers tend to participate strongly, helping to halt the price decline and create a foundation for a potential recovery.
Resistance levels: These are areas where the price is higher than the current price, where selling pressure typically increases, halting the upward momentum and limiting the price’s ability to continue rising.
RSI divergence forms important price pivot points. Utilizing them as support and resistance levels helps you identify entry and exit points more accurately.
Trading strategies based on regular divergence
Trading strategies based on regular divergence
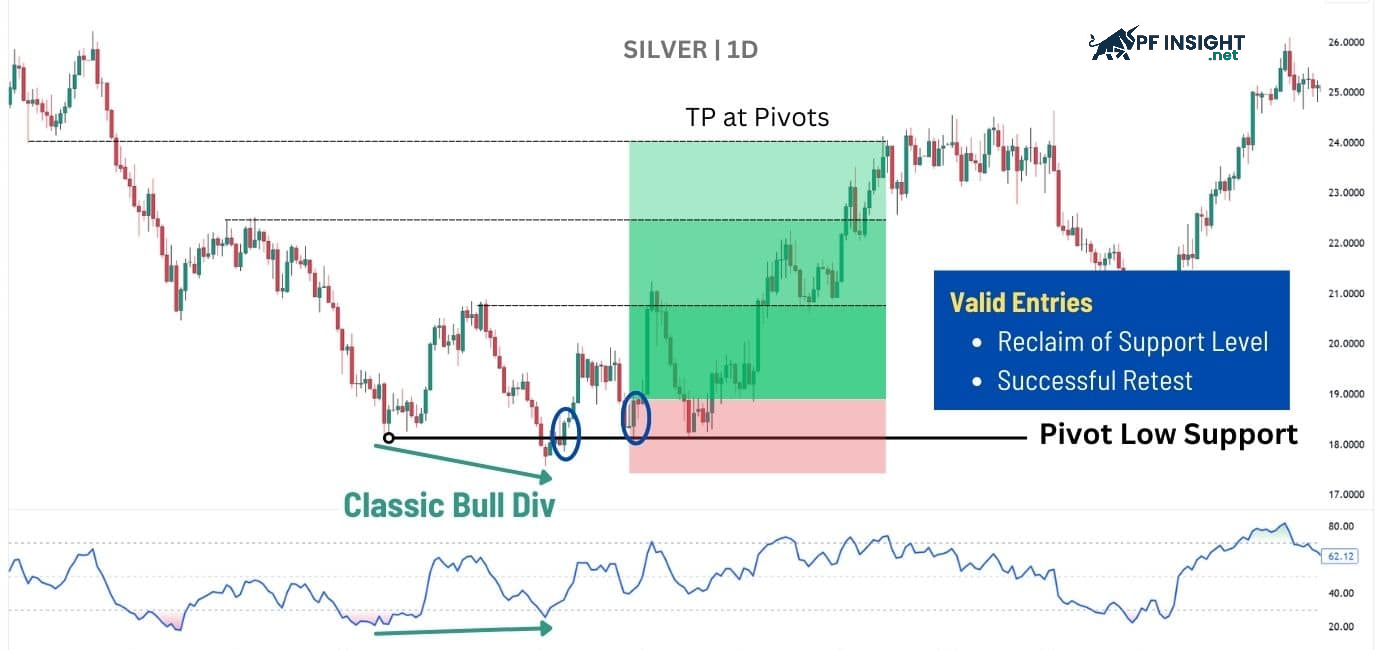
In a downtrend, not every low signals a reversal. Bullish divergence occurs when the price creates a lower low but the RSI creates a higher low, indicating that selling pressure has subsided. However, for safety, you should wait for the price to break above the previous reversal low. This is a confirmation that the buyers have taken control, helping you avoid bearish traps.
A breakout above the pivot point confirms a trend reversal from bearish to bullish. The transformation of resistance into support not only strengthens the trend but also opens up opportunities for long-term price increases.
To execute a trade, the trader does the following:
Entry: Enter the trade after price rebounds from the pivot low and closes strongly.
Target: Aim for the previous pivot highs to ensure a favorable risk-to-reward ratio.
Stop loss: Place the stop loss below the pivot low to limit downside risk.
Waiting for structural changes helps investors avoid the “early entry” trap, focusing instead on high-probability reversal signals. For sell orders, observe the pivot peak and wait for the price to close below the resistance level to confirm the start of a downtrend.
Trading trends with hidden divergence signals
Trading trends with hidden divergence signals
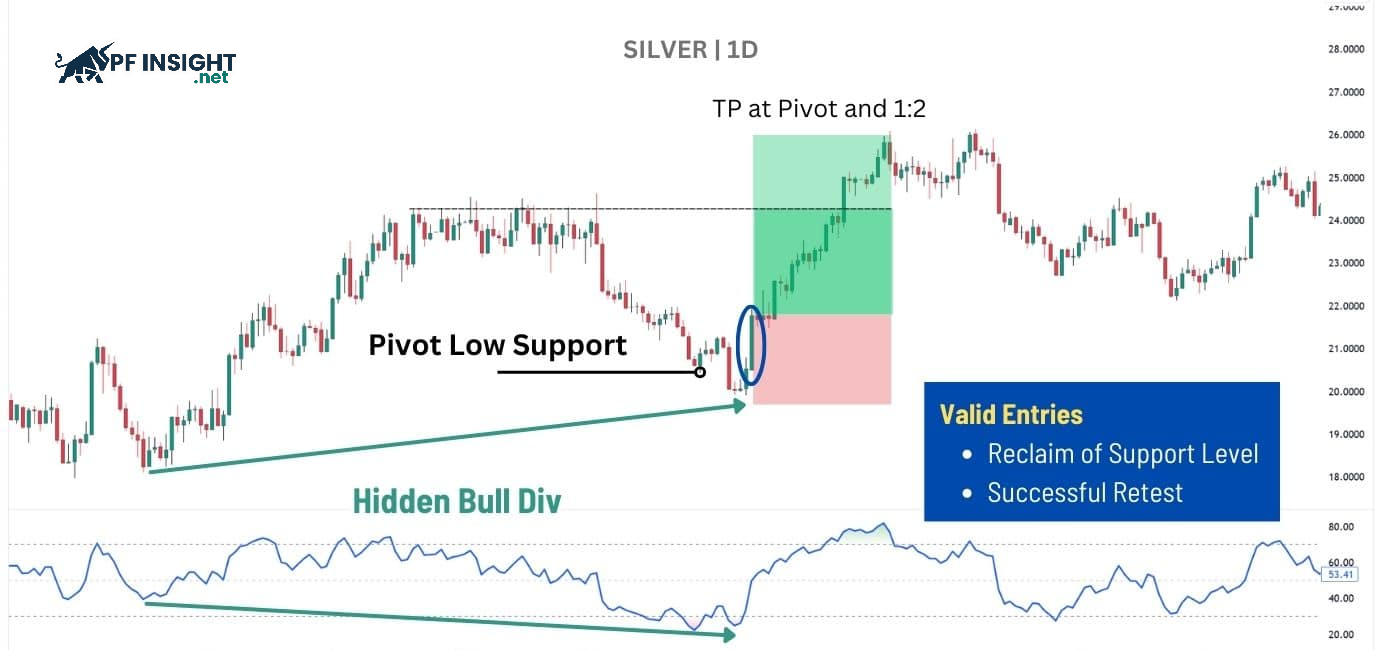
A hidden bullish divergence occurs when the price creates a higher low but the RSI shows a lower low in an uptrend. This phenomenon confirms that the bearish momentum has weakened, lacking the strength to break the market structure. This is a reliable signal predicting that the price will soon resume its upward trend.
Confirmation occurs when the price breaks above the pivot bottom, indicating that the buyers have successfully defended the trend. The strongest buy signal is when the price breaks above the pivot top, demonstrating that the upward momentum remains strong and the trend will continue.
To execute a trade, the trader does the following:
Entry: Enter the trade when price rebounds from the pivot low and shows a strong closing candle confirming buying pressure.
Target: Aim for the previous pivot highs while maintaining a minimum risk-to-reward ratio of 1:2.
Stop loss: Place the stop loss below the pivot low to minimize potential losses.
This strategy focuses on trend-following setups to increase the win rate. For short positions, you need to find the pivot point and only enter the trade when the price closes below the resistance level, ensuring maximum safety.
Using RSI divergence with moving average breaks in trading
Using RSI divergence with moving average breaks in trading
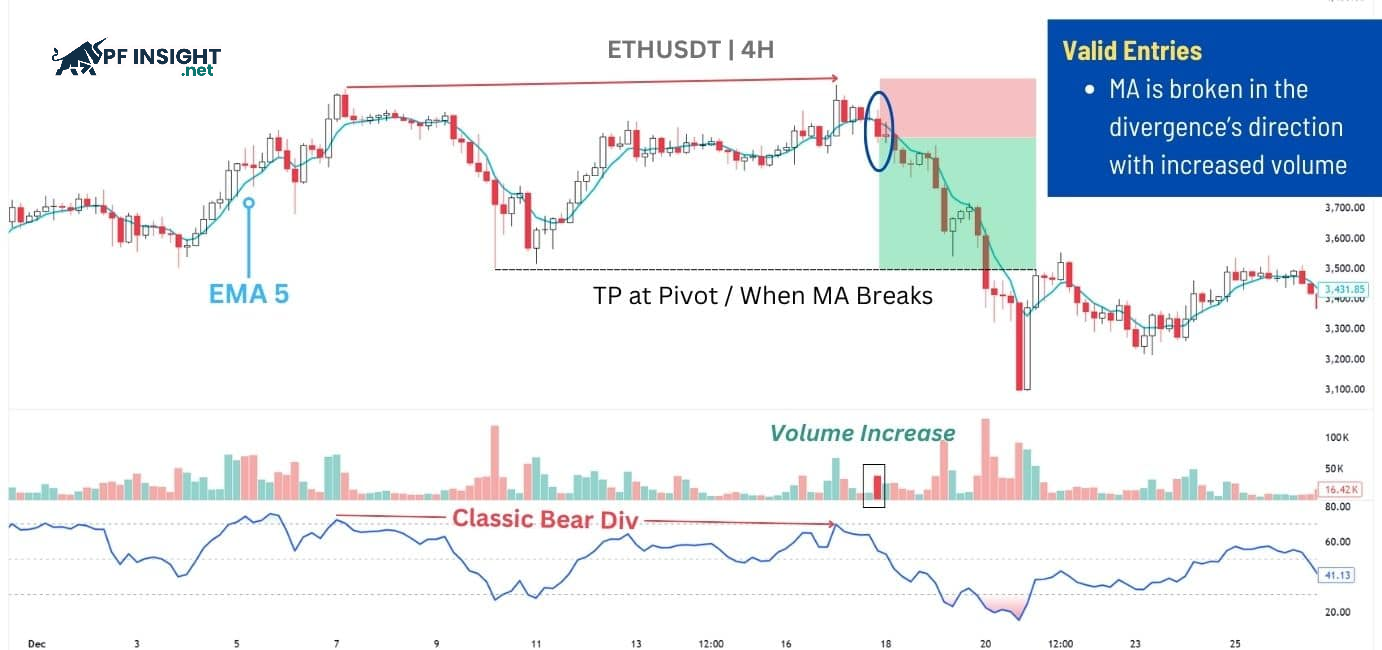
The combination of divergence and breakout of moving averages optimizes entry timing. This approach ensures trades are made in the right direction with reversal signals, thereby increasing the success rate. With this strategy, you should prioritize short-term moving averages, such as the 5-day moving average (MA 5).
Divergence provides trading direction, while a price breakout above the MA line is key to identifying the precise entry point, signaling an impending period of significant volatility. For added reliability, observe trading volume; a sudden surge in volume confirms a sustained signal and increases the probability of a win.
To execute a trade, the trader does the following:
Entry: Enter the trade after price breaks above the EMA 5 with a strong increase in trading volume, in the direction of the divergence.
Target: Aim for previous pivot levels, or apply a 1:2 risk-to-reward ratio if the nearest pivot level is too close.
Trade management: Once the initial target is reached, keep part of the position open and take profit when price breaks back through the EMA 5. Then, move the stop loss to the entry point.
Stop loss: Place the stop loss beyond the nearest swing point relative to the entry to limit risk.
Buy orders: Place the stop loss beneath the latest pivot low.
Sell orders: Place the stop loss above the latest pivot high.
This strategy allows for early profit taking and maintaining a natural position, enabling more proactive and effective risk management as prices change.
Important notes when applying the RSI divergence strategy
When applying the RSI divergence strategy, traders need to understand that divergence signals do not always lead to immediate reversals. Combining confirmation, risk management, and market context will help limit false signals.
Avoid excessive reliance on one tool: Don’t become overly dependent on RSI divergence. Always observe the market context, price structure, and combine it with other technical tools for a multifaceted perspective. This helps you avoid false signals and make safer, more accurate trading decisions.
Analyze the broader market context: Effective trading requires a holistic view. You need to check if the RSI signal is appearing at key price levels. Placing the indicator in the correct market context helps you distinguish between genuine opportunities and price traps.
Choose a suitable timeframe: Prioritize larger timeframes (H4, D1) for accurate and sustainable divergence signals. Conversely, smaller timeframes like M5 and M15 often produce many false signals, easily causing confusion and increasing risk for traders.
Record trades and learn from experience: Detailed record-keeping of RSI divergence trades helps you identify recurring mistakes and high-probability setups. Over time, this journal will become a valuable data repository for refining your strategy, helping you improve your skills and confidence in the market.
Conclude
RSI divergence is a useful tool that helps traders identify early signs of trend weakening and potential market reversals. According to PF Insight, for optimal effectiveness, RSI divergence should not be used in isolation but should be combined with price action, support and resistance zones, and proper capital management. When applied correctly, RSI divergence becomes a powerful tool in trading.