Finding the right entry point is key to improving trading performance in the financial markets. The pullback trading strategy stands out for its ability to optimize risk by focusing on corrective phases within strong trends. This strategy allows traders to trade with the trend instead of risking breakouts. This article from PF Insight will help you understand the nature of pullbacks and how to trade them effectively.
- News trading strategy: How economic data moves markets instantly
- Trend trading method simple rules for identifying strong trends
- Copy trading for beginners: How to follow experienced traders safely
What is pullback trading?
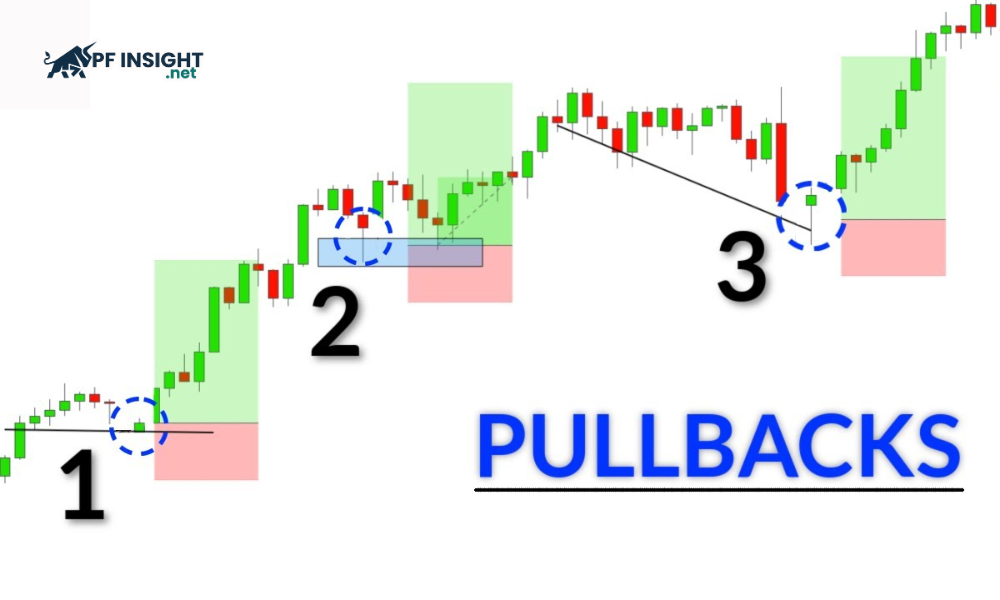
Pullback trading is a strategy that exploits temporary price corrections within a clear trend. When the market is neither rising nor falling, prices often experience short pullbacks before resuming the original trend. Traders use pullbacks to enter trades in the direction of the trend at better price levels, rather than trading emotionally or chasing strong price movements.
When the market is in an uptrend, pullbacks are a normal phenomenon in technical analysis. Prices may pause or retreat for a short period before continuing to rise. This presents an opportunity for traders to enter the trend with a more favorable entry point. Unlike reversals, these corrections do not change the overall trend structure.
How does the pullback trading strategy work?
The pullback trading strategy is based on the principle of trading with the trend through small price corrections. When the market retraces to key price levels, traders take advantage of the opportunity to enter trades with lower risk. Buying in an uptrend or selling in a downtrend helps improve overall performance.
Instead of rushing into trades, traders often wait for clear price signals such as a bounce from support, a touch on a trendline, or a reaction to a moving average. Pullback trading strategies utilize these moments to enter the market in a disciplined manner. Entering trades after a correction helps reduce stop-loss distances and improve the risk-reward ratio, so pullbacks are highly valued by both novice and professional traders.
Common pullback types
Pullback trading isn’t always the same; it varies in depth, duration, and price movement. Understanding each type of pullback helps traders better manage risk and trade effectively in line with the main trend.
Shallow pullbacks
Shallow pullbacks refer to minor price corrections, where the decline does not exceed 38% of the previous upward momentum. These pullbacks typically occur within strong trends and are short-lived. This indicates that either buyers or sellers remain in control of the market and are ready to re-enter immediately after the correction.
Deep pullbacks
Deep pullbacks are significant corrections where the price retraces by approximately 38% to 61.8% of the preceding uptrend. Despite the stronger corrections, they often occur within a clearly trending market. These deep pullbacks typically offer more attractive entry points, but also increase the risk of reversal if the price breaks out of the normal correction zone.
Complex pullbacks
Complex pullbacks are prolonged corrective phases where the price doesn’t fall or retrace in a clear direction, but instead fluctuates sharply and moves sideways with many small highs and lows. These phases reflect market indecision and can last for days or even weeks. Trading during complex pullbacks is often risky due to unstable signals. Therefore, many traders prefer to wait for a clear breakout signal to confirm the trend before entering a trade.
Signs of pullback trading

Accurately identifying pullbacks improves trading efficiency. Below are common signals to identify pullbacks in the market.
- Small candle bodies: In pullback trading strategies, the size of candle bodies is usually smaller than those of the preceding uptrend. The appearance of candlestick patterns such as spinning tops or Dojis reflects market indecision. For example, in a strong uptrend with long green candles, the correction phase is often represented by small candles, alternating between bullish and bearish.
- Multi-colored candles: Observe candlesticks of multiple colors (e.g., alternating red and green) in an uptrend. This appearance suggests the market is pausing, buying and selling pressure is balanced, and it may be preparing for the next move.
- The presence of candle wicks: Pullback trading strategies often feature multiple upper and lower wicks, indicating price indecision. Long wicks on both sides warn of a potential reversal during a downward correction.
Spotting pullbacks vs reversals
Distinguishing between pullbacks and reversals is crucial in trading. This ensures the selection of methods and targets appropriate to each market situation. Below is a comparison table between pullbacks and reversals:
| Pullback | Reversal | |
| Essential differentiating signals | Pullback trading strategies primarily occur around key price levels, such as support and resistance, reflecting a temporary balance between buyers and sellers. |
During sharp reversals, prices frequently break through key support and resistance levels. |
|
Analysis of price structure |
Pullbacks in uptrends remain above the previous low of the long-term support level, while in downtrends, pullbacks usually do not surpass the most recent high of the long-term support level. | In both uptrends and downtrends, reversals often involve breaking through key lows or highs. |
| Volume and momentum | During a pullback, trading volume typically decreases, and the upward momentum of the price also slows down. |
Reversal is often accompanied by strong momentum and large trading volume, which determines the next direction of the trend. |
Top 4 pullback trading strategies today
There is no perfect pullback trading strategy. Below are some common methods that traders often use.
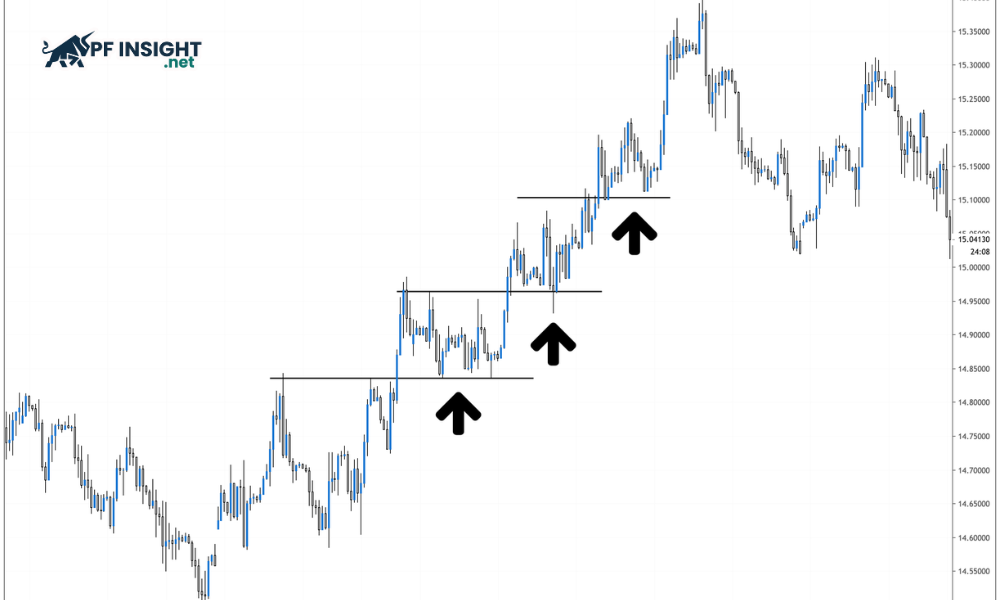
Pullback trading strategy with trendlines
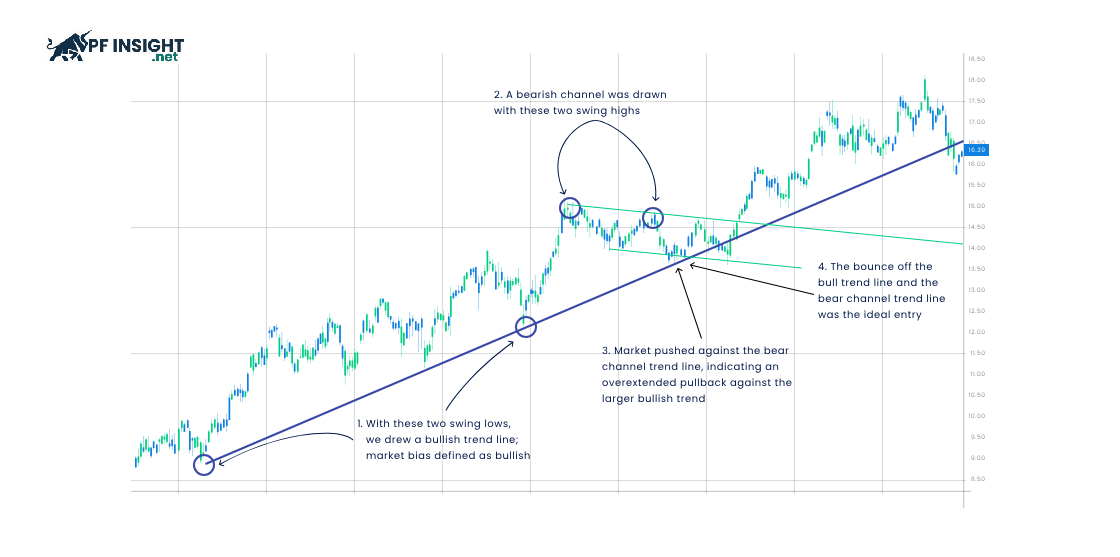
Trend lines help identify the direction of the market. When three or more consecutive peaks or troughs are connected, they form an uptrend or downtrend line. Traders can take advantage of pullbacks along trend lines, where higher prices appear before lower prices, indicating that the current trend persists after temporary corrections.
- Sell: You can open a sell order along the trend line when successive lower lows appear, indicating that the downtrend is still maintaining after a temporary rally.
- Buy/Sell: Buy or sell orders can be executed at the third, fourth, or fifth high/low price level along the trend line, helping to confirm the current uptrend or downtrend.
Pullback trading with Fibonacci retracement
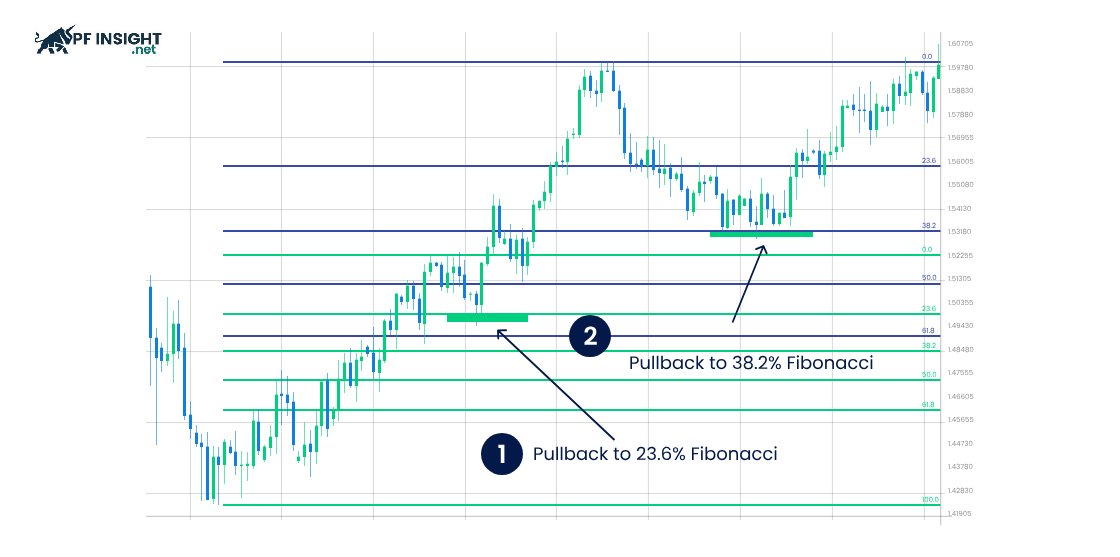
Fibonacci retracement identifies ideal price points for trading in uptrends or downtrends. Additionally, these levels indicate important support and resistance zones, assisting traders in deciding whether to buy or short. A pullback trading strategy using Fibonacci helps assess price retracements before the main trend resumes, optimizing entry points.
- Downtrend below 23.6% and 38.2%: When the price only slightly corrects to the 23.6% or 38.2% Fibonacci level, this area often becomes temporary resistance. Traders may short sell, anticipating the downtrend will continue after the short-term pullback.
- Upward trend above 61.8% or 78.6%: When the price touches the 61.8% or 78.6% Fibonacci level, the market has corrected significantly, simultaneously forming a temporary support zone. Traders can take advantage of this to enter buy orders, anticipating a continuation of the uptrend.
- Uptrend lower levels of 23.6% and 38.2%: The Fibonacci retracement levels of 23.6% and 38.2% indicate that the price is approaching resistance, with a high potential for a breakout. Traders can open buy orders, expecting the uptrend to continue.
- Downtrend above 61.8% or 78.6%: Fibonacci levels as high as 61.8% or 78.6% indicate that the price is approaching a support zone and is likely to break through. Traders can place sell orders to take advantage of the continuing downtrend.
Pullback trading strategy with Moving Average
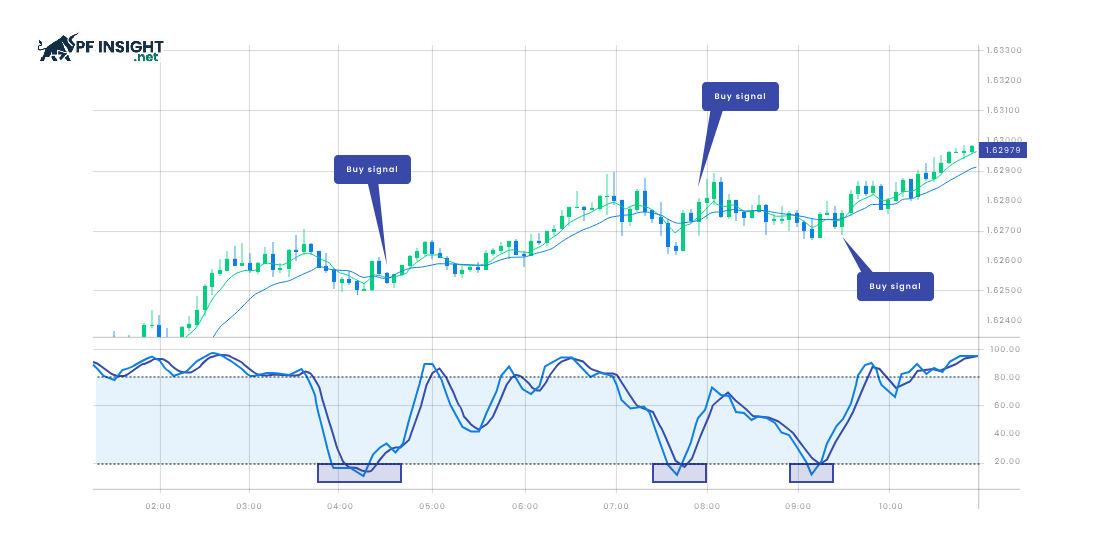
Moving Averages (MA) are a popular tool for identifying pullbacks in uptrends. This indicator calculates the average price of a currency pair over a specific period and compares it to the current price, helping traders identify temporary corrections, assess the main trend, and find safe entry points.
- Buy: When the current price is significantly lower than the moving average in an uptrend, this signals the possibility of a short-term pullback, creating an opportunity for traders to enter a buy order.
- Sell: The current price is significantly higher than the MA in a downtrend, suggesting a temporary rally may occur. This presents an opportunity to place a short sell order and capitalize on the long-term downtrend.
Pullback trading with breakout
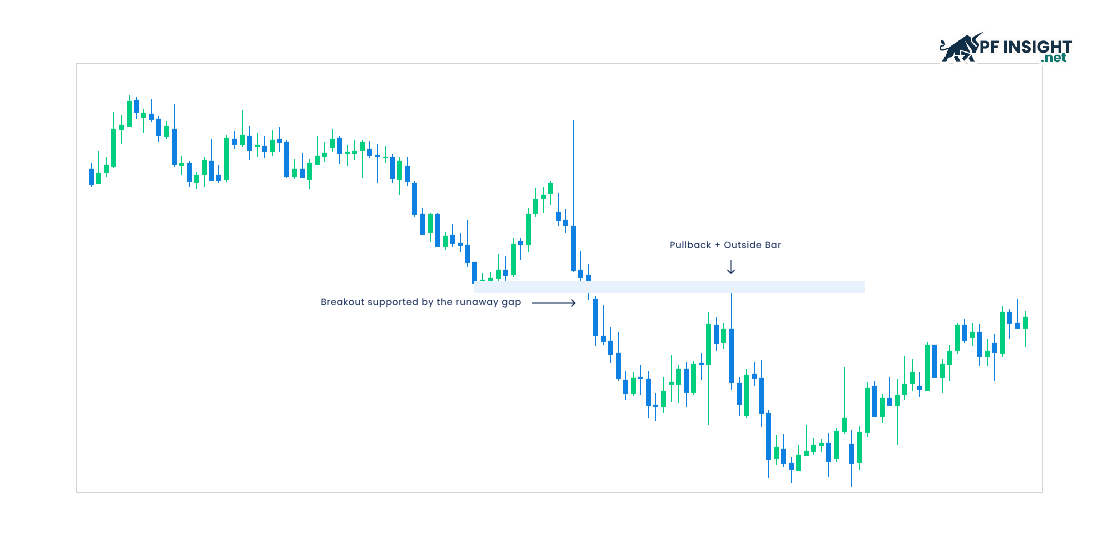
A breakout allows traders to enter a trade when the price surpasses a resistance or support level. These movements go against the current trend, creating opportunities to capitalize on temporary trend surges in the market.
- Buy: When the price in an uptrend temporarily touches a support level and narrows, this breakout signals a downward correction and provides an opportunity to enter a buy order to benefit from the subsequent uptrend.
- Sell: When the price in a downtrend temporarily touches and extends above resistance, this breakout reflects an upward correction and provides a short-selling opportunity to profit from the subsequent downtrend.
Advantages and disadvantages of pullback trading strategy
The pullback trading strategy is a popular method that helps traders take advantage of temporary corrections within a trend. While it offers opportunities to enter trades in the direction of the trend, this strategy also has risks and limitations that need to be considered.
Advantage
- This method helps traders approach entry points with lower risk, instead of trying to catch breakouts or trade at tops and bottoms, thereby reducing the likelihood of overpaying.
- Pullback trading strategies offer a better risk/reward ratio, as traders can enter the market when prices correct and are near key support levels.
- The pullback trading strategy offers flexibility for application in various situations. It is particularly effective in markets experiencing significant corrections and relatively low volatility.
- This method is compatible with a wide range of timeframes and asset types, from day trading to long-term investing, making it easy for traders to adapt to various trading styles.
Disadvantages
- In some cases, pullback trading can turn into a complete reversal, leading to incorrect entry and losses for traders.
- Irregular corrective signals combined with complex, hard-to-identify patterns require high analytical skills and patience when trading.
- Traders need to patiently wait for confirmation signals before entering a trade, which is difficult to do in fast-moving markets.
- Pullback trading strategies are ineffective in markets without a clear trend or with high volatility, where prices move erratically and are prone to triggering multiple stop-loss orders.
Conclude
The pullback trading strategy is a useful tool that helps traders take advantage of temporary corrections within a trend. When applied correctly, this strategy helps reduce risk and optimize entry points. However, to succeed, traders need patience, technical analysis skills, and effective risk management.


