In the financial world, position trading strategy stands out as a safe and effective trading method for long-term investors. Instead of reacting to each price move, this strategy focuses on holding positions for weeks to months. With the combination of technical analysis and trading discipline, position trading gives patient traders a superior advantage.
- Swing trading strategies how to balance risk and reward effectively
- Day trading: how traders take advantage of small intraday price movements
- Arbitrage forex types of arbitrage used in currency trading
What is a positional trading strategy?
Position trading strategy is a long-term trading strategy where traders hold positions for weeks or months. The goal is to take advantage of the overall larger market trend and maximize profits instead of focusing on short-term fluctuations.
Unlike scalpers or day traders who seek small profits from quick price movements, a position trader will patiently hold a position for weeks or months. They tolerate short-term fluctuations to focus on the big picture. Their goal is to take full advantage of a strong trend and only exit when their long-term price target has been reached.
Position trading focuses on following the larger market trend. Traders try to hold positions long term to take advantage of the entire surge or decline of that trend.
Although the position trading strategy is based on long-term trends, identifying the right trend is not easy. A clear trend on the D1 chart is sometimes just a sideways zone when viewed on the W1 chart. Therefore, many position traders not only rely on the trend but also set profit targets before entering an order. They often analyze major support and resistance zones to find safe entry points and exit orders at the right time.
Who is a position trading strategy suitable for?
Position trading is not for all traders. It is a long-term trading style that requires patience, calmness, and the ability to look beyond short-term fluctuations. If you belong to one of the following groups, position trading is the ideal choice.
- Long-term vision: Position trading focuses on holding assets for months or even years to profit from long-term market trends, rather than short-term price fluctuations.
- Traders have less time to monitor the market: Position trading strategies require significantly less time to monitor the market than day trading or swing trading. You only need to check your positions and perform periodic analysis (e.g., once a day or once a week).
- Highly patient: Since positions are held for long periods of time, you must be willing to wait for potential profits to materialize and withstand temporary adverse movements without panicking.
- Prioritizing reduced emotional stress: Due to the lower trading frequency and ignoring small daily fluctuations, this strategy helps reduce emotional stress compared to high-frequency forms of trading.
- Good fundamental analysis skills: While technical analysis can be incorporated, position traders typically rely on assessing the financial health, growth prospects, and industry position of a company/asset to confidently hold long-term.
- Suitable for beginners: This strategy is suitable for beginners because of its simple approach, does not require constant market observation and helps to limit being affected by emotions when prices fluctuate strongly in the short term.
Indicators supporting position trading strategy
Position trading strategy prioritizes confirming long-term trends rather than paying attention to small fluctuations during the day. Therefore, the indicator system must have enough lag to filter noise and reflect market movements over long cycles. Below are strong indicators, used by many veteran traders when trading in this long-term style.

Moving average MA 100 – MA 200
MA100 and MA200 are important tools in position trading strategies. They allow traders to identify the overall direction of the market, assess the strength of the trend, and identify important price zones to optimize entry and exit points.
- When the MA200 is pointing up, the market shows a sustainable long-term uptrend.
- When MA200 is pointing down, the long-term downtrend is dominant.
- In addition, MA200 also helps eliminate most short-term noise fluctuations, retaining core price movements so that traders can easily assess the true trend of the market.
Find a safe entry point: Traders often wait for the price to return to MA100 or MA200 before opening a position in the direction of the main trend, helping to reduce risk and increase the reliability of the entry point.
MACD
MACD not only reflects market momentum but also helps traders assess the strength of a trend. In position trading strategies, MACD is used to confirm whether the current trend is strengthening or weakening.
- When the MACD is above the Zero line, the market shows that the long-term uptrend is in control and buying power is dominant.
- When the MACD is below the Zero line, it reflects that the long-term downtrend is still the main flow of the market.
- The narrowing MACD histogram shows that the market momentum is decreasing. This is a signal that the trend force is weakening and the market is about to enter a correction phase.
Note: MACD is not suitable for predicting tops or bottoms in position trading strategies. Use MACD as a trend confirmation tool, ensuring that you are trading in the correct direction of the main market movement.
Long term RSI (RSI 14 or 21)
Many traders misuse RSI when trying to pick tops and bottoms. But with position trading strategies, RSI is used to measure trend strength, helping to assess buying and selling pressure on a long-term timeframe.
- When the RSI is above 50, the market shows overwhelming buying pressure and the uptrend is dominant.
- Conversely, when RSI is below 50, selling pressure is stronger and the downtrend becomes the dominant direction.
In position trading strategy, the long-term overbought/oversold zone of RSI is not a reversal signal. The purpose is to check whether the trend momentum is still strong enough to continue. Thanks to that, traders limit the entry of orders in the opposite direction, causing unnecessary losses.
Fibonacci Retracement
Fibonacci Retracement is an important tool to identify correction zones in major trends. In position trading strategies, traders often apply Fibonacci on Daily, Weekly or Monthly frames to find standard retracement levels to optimize long-term entry points.
- 38.2% – indicates a slight correction in the trend.
- 50% – shows the market is in a moderate correction.
- 61.8% – reflects a deep correction but the major trend remains intact.
Choose a good entry area according to the big trend:
- Prioritize Buy in an uptrend when the price corrects to the 38.2%–61.8% area.
- Prioritize Sell in a downtrend when the price rebounds to the 50%–61.8% zone.
- Combine MA100 or MA200 to increase the reliability of entry points and improve the probability of winning.
Top 5 popular position trading strategies
Trend Following strategy
Trend trading is the core foundation of position trading strategy and has been proven through many market cycles. The principle is simple: identify the main trend – up or down and open positions in that direction to maximize profits and reduce risks.
How it works:
- Traders often rely on long-term moving averages like the 50- and 200-day SMA or EMA to identify the direction of the market.
- If the price stays above the MA lines, the uptrend is dominant; if below, the downtrend is still dominant.
- The strategy is to enter when the trend is confirmed and only exit the market when a clear reversal signal appears.
While trend trading is very effective, traders still need to be highly disciplined as the market is prone to false breakouts and disruptive corrections. Even experienced traders can be fooled. Therefore, establishing a clear set of trading rules and a strict risk management plan is indispensable.
Fundamental + Technical hybrid
While technical patterns are a useful tool in a position trading strategy, many professional traders also incorporate macro and fundamental analysis for a more comprehensive view. This approach provides a deeper insight into the value of an asset and identifies economic factors that can drive significant price movements.
How it works:
- Use fundamental analysis to select companies or sectors with good fundamentals, such as stable earnings, low debt ratios, or sustainable growth strategies.
- Combine technical analysis to determine optimal entry/exit timing when fundamentals are giving strong signals.
- Keep an eye on economic indicators, central bank policies, earnings reports and industry news to stay on top of catalysts that could influence long-term trends.
Breakout trading
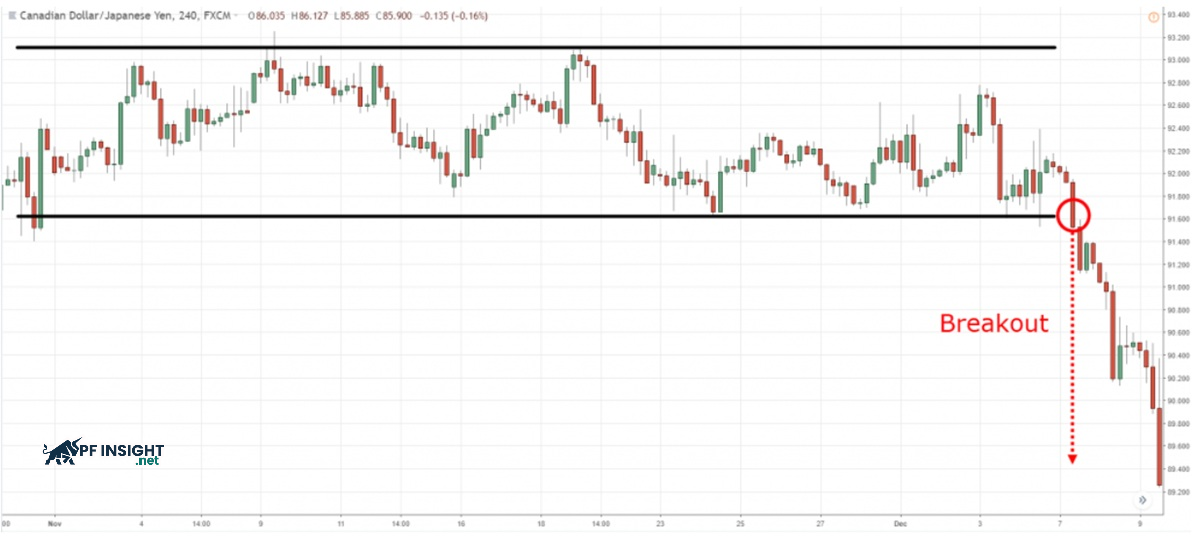
A breakout trade occurs when the price breaks out of a previously formed support or resistance area. The surge in volume often confirms that buyers or sellers are in control, creating momentum for the new trend. Traders use this signal to enter momentum trades, hoping that the price will continue to move strongly.
How it works:
- Traders look for sideways market periods and technical patterns like triangles, pennants or consolidation zones to look for signs of an impending breakout.
- When the price breaks above the resistance zone, the market is usually inclined towards the uptrend; conversely, if the price falls below the support, selling pressure is dominant.
- Trading volume is a key factor in confirming that the breakout is strong enough and likely to sustain.
However, not all breakouts are reliable, as false breakouts still appear frequently. Therefore, traders should combine confirmation tools such as RSI, MACD or volume data to avoid noise and increase the ability to identify accurate signals.
Pullback (Retracement) trading
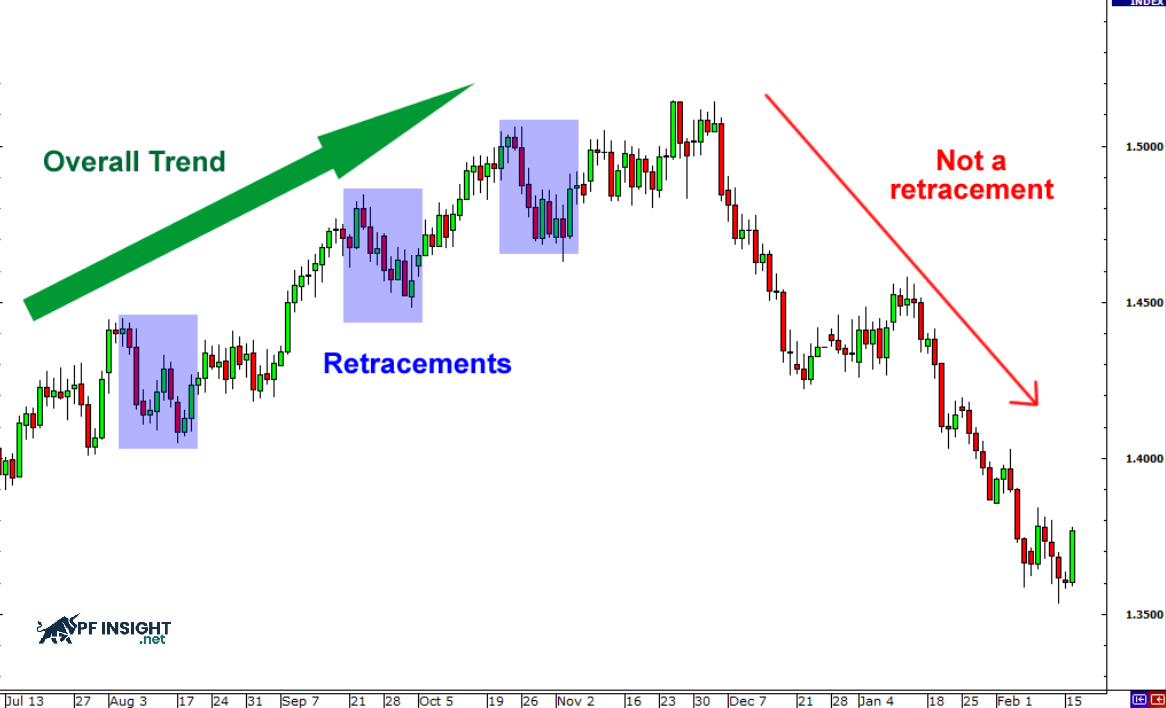
Instead of chasing breakouts, many traders wait patiently for the price to correct. When the market pulls back in the current trend, they take advantage of better prices to enter the trade, which is both safe and increases the risk-reward ratio.
How it works:
- Traders first identify a clear trend, then patiently wait for the price to adjust to the support zone or important MA lines to find a safe entry point.
- Popular Fibonacci retracement zones such as 38.2%, 50% and 61.8% are applied to identify areas where price can bounce.
- The decision to enter a trade is often reinforced by a reversal candlestick pattern, momentum signal or price action that suggests the trend is about to continue.
Note: Patience is key, if you enter too early in the correction, you may face further bearish pressure before the main trend returns. Waiting for confirmation signals always helps to limit risks.
Multiple timeframe analysis
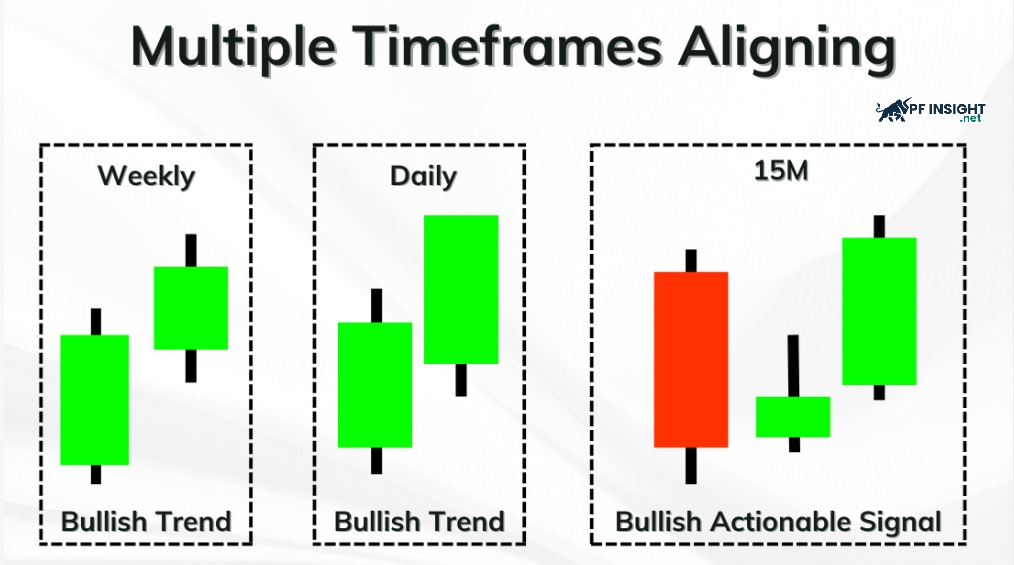
Many position traders believe that analyzing one time frame is not enough. Therefore, they evaluate assets on the Daily, Weekly, and Monthly time frames to determine the main direction of the market. This approach helps them trade in harmony with the strongest trend.
How it works:
- Larger time frames (Weekly or Monthly) help identify the main trend of the market.
- The intermediate time frame (Daily) is used to check whether the trend is being maintained or not.
- Small timeframes (H4 or Intraday) help fine-tune entry and exit points to optimize the profit/risk ratio.
Analyzing the market on a time frame basis allows traders to clearly identify the core trend, thereby avoiding being fooled by small fluctuations. As a result, they do not rush to react to short-term reversals and maintain positions in line with the larger market developments.
Common mistakes when applying position trading strategy

Position trading strategies, while seemingly simple, are fraught with serious pitfalls, mainly due to psychological factors and lack of discipline. Here are some common mistakes position traders make:
Using too much leverage: One of the most dangerous mistakes is using high leverage when trading long-term. Since Position Trading places wider stop-losses to avoid market noise, using high leverage makes the account susceptible to:
-
- Lose early before the trend really starts in the right direction.
- Accounts drop sharply due to overreaction to short-term fluctuations.
- Vulnerable to stop hunting by strong market sweeps.
Impatience and Overtrading: Position trading strategies require a high level of patience, as larger trends often take a long time to develop and run their course. Many traders make the mistake of getting caught up in the small daily movements and start trading constantly like a day trader. This “jumping in and out” of the market not only increases their trading costs but also causes them to exit their positions too early, missing out on profits that could have been made from the longer-term trend.
Emotional trading: One of the biggest risks in position trading is letting emotions take over. FOMO causes traders to enter late, chasing a strong trend and easily getting stuck at the top. Greed causes them to refuse to take profits as planned, hoping the trend will continue. The result is often that profits evaporate and a good position becomes a burden.
Poor position sizing: A serious mistake in a position trading strategy is to put too much capital into a single position. Although long-term trading is less volatile, a single negative news or unexpected event can cause a sharp decline in price. By betting too much on an asset, a trader not only suffers a large loss but also loses the opportunity to allocate capital to other potential trades.
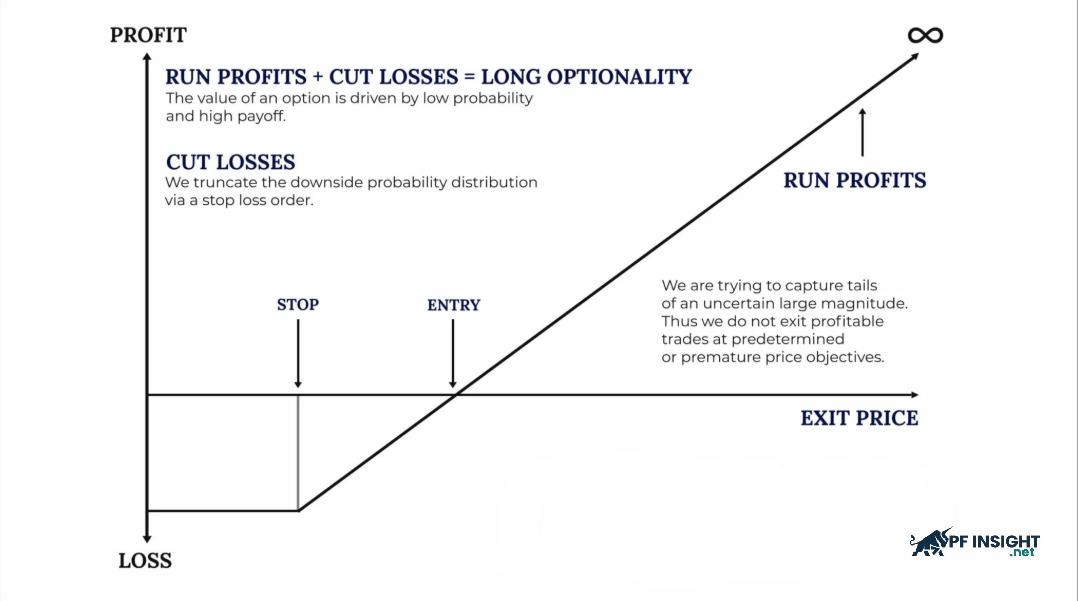
Taking profit too soon: Position trading strategies aim to capture large profits from trends that last for months or years. However, many traders take profits too early after achieving small gains of 10–20%, due to the fear of losing their gains. Selling too early on an asset with high upside potential causes them to miss out on much of the subsequent price increase. This is a common mistake that ruins the entire strategy, contrary to the golden rule of “holding profits and letting the trend do the rest”.
Tips for effective trading with position trading strategy

To trade effectively with position trading strategy, you do the following:
- Understand the trading assets thoroughly: Position trading strategy requires a long-term vision, so understanding the assets in detail is a must. This helps traders evaluate the real value, predict factors affecting the big trend and confidently hold long-term positions.
- Only trade with capital you are willing to risk: In position trading, positions are often large and held for a long time, so you must ensure that the capital used does not affect your personal finances. Determining a reasonable position size helps you control risk and keep your mind steady during short-term market fluctuations.
- Set clear rules: Before entering a position, set a set of rules that include a loss tolerance, a profit target, and an expected holding period. A risk-reward ratio of 3:1 is generally considered optimal for long-term trading. The discipline of these rules helps you avoid emotional decisions and maximize profits. Since position trading lasts for weeks or months, planning based on market data and fundamentals is extremely important.
- Understand the market trend: Market conditions largely determine the success of a long-term position. An asset that lacks momentum or is pulled down by the general trend may no longer be suitable for position trading. Assessing market volatility will help you choose the right long-term or short-term strategy. Generally, position trading works best in trending markets, especially when a strong downtrend is in place.
- Managing emotions: Constantly monitoring price movements can lead to fear or greed leading to hasty decisions. Going against the established rules will significantly reduce the potential profit from a long-term position.
Conclude
Position trading strategies are not suitable for those who want quick profits, but they are powerful tools for long-term traders. According to PF Insight, by managing risks and being disciplined, traders can take advantage of big trends, minimize short-term risks and create sustainable profits, turning long-term strategies into a stable source of income.


