Pivot Points Trading is not simply a calculation tool, but also a method that helps traders logically understand market structure. Based on price data from the previous session, this method helps traders optimize entry points and manage risk more effectively in highly liquid markets.
- What is the ATR Indicator and how it works in trading
- How to use Parabolic SAR in Trend-Following trading
- Ichimoku cloud how it works in real trading
What is Pivot Points Trading?
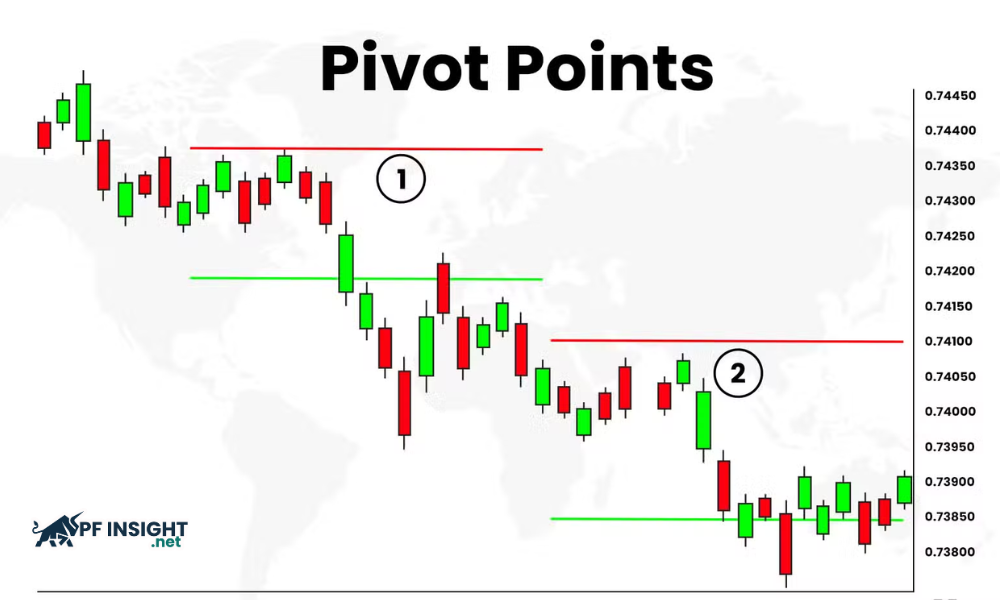
Pivot Points are a technical indicator widely used by traders to identify key price zones in advance. Based on historical price data, this tool helps predict support and resistance areas, supporting more effective trading decision-making.
Pivot Points Trading uses the high, low, and closing prices of the previous session to identify the central pivot point along with related support and resistance levels. These price levels help traders assess the strength of the trend and plan their trades more clearly. Price moving above the pivot usually indicates that buying pressure is controlling the market, while price below the pivot signals a downtrend and increased selling pressure.
Components of the Pivot Point
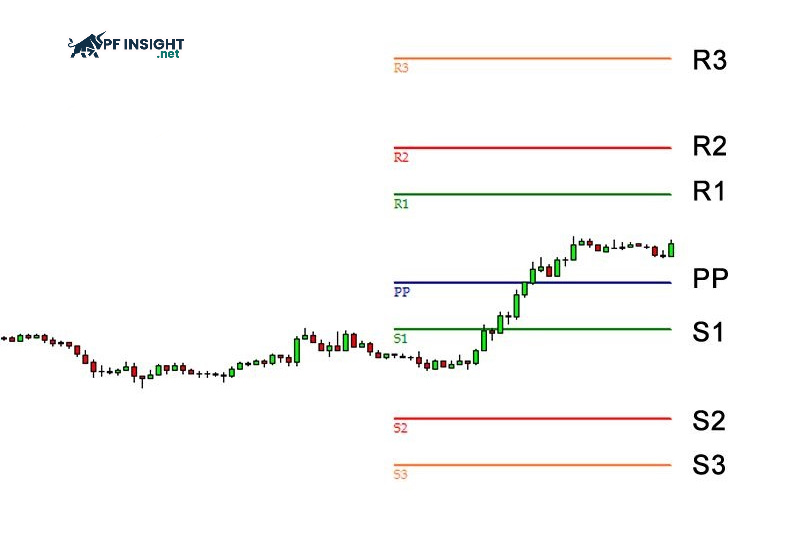
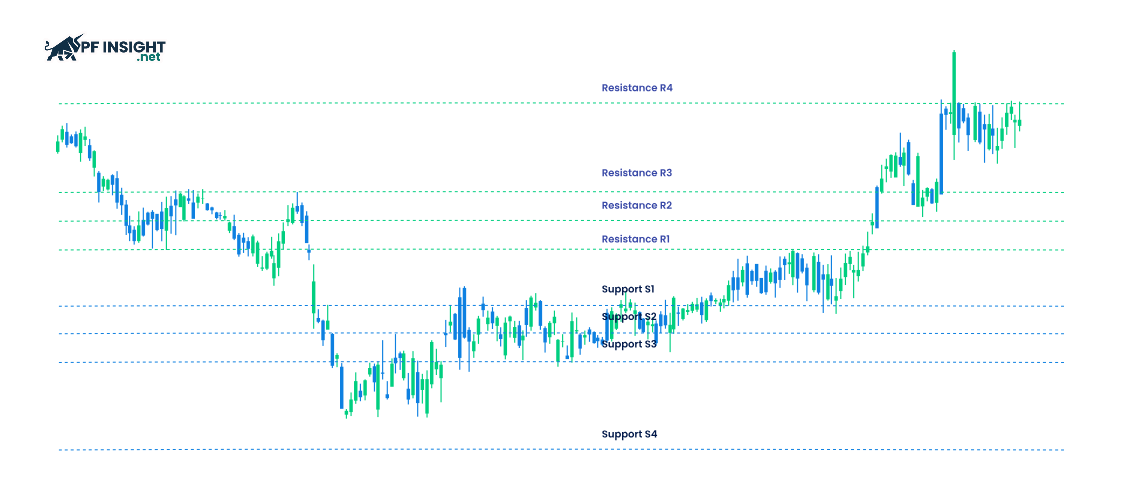
Looking at the chart, Pivot Points Trading may seem complex at first glance, but in reality, its constituent components are very familiar to traders. The Pivot Point indicator establishes a system of clear horizontal price levels, helping to identify support and resistance zones.
- P (PP) – Center Pivot Level: This is the main line of the Pivot Point, also known as the pivot point or pivot point, serving as an important reference point for the entire system.
- R – Resistance levels: R1, R2, and R3 are three resistance lines identified above the PP line, representing price zones where selling pressure may increase.
- S – Support Levels: S1, S2, and S3 are three support lines located below the PP line, representing price areas where buying support is likely to be received.
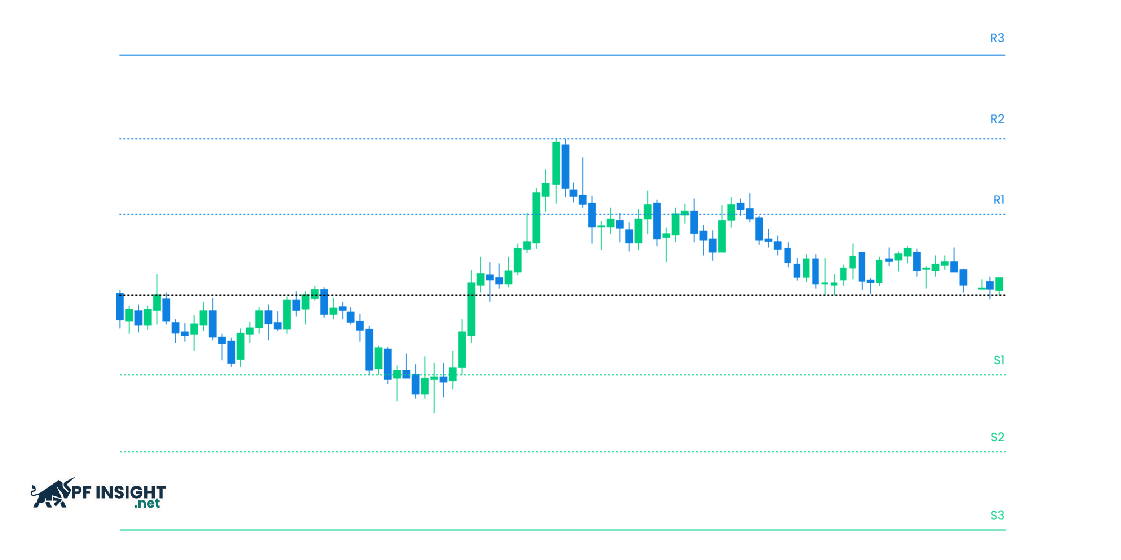
Based on the illustrations, traders can easily identify the key features and significance of the price levels in the analysis.
- When the closing price appears near the upper part of the candlestick body, the PP line (Pivot Point) will also be identified in the upper area of that candlestick.
- Conversely, if the closing price is below the candlestick body, the PP line will correspondingly be located at the bottom of the candlestick.
- If the closing price falls exactly between the highest and lowest price ranges, the PP line will coincide with the closing price.
Different Pivot Point variations
Each type of pivot point offers its own advantages, giving traders flexibility in analysis. To increase accuracy, traders often combine them with other indicators. Below are four widely used types of Pivot Points Trading.
Standard Pivot Points
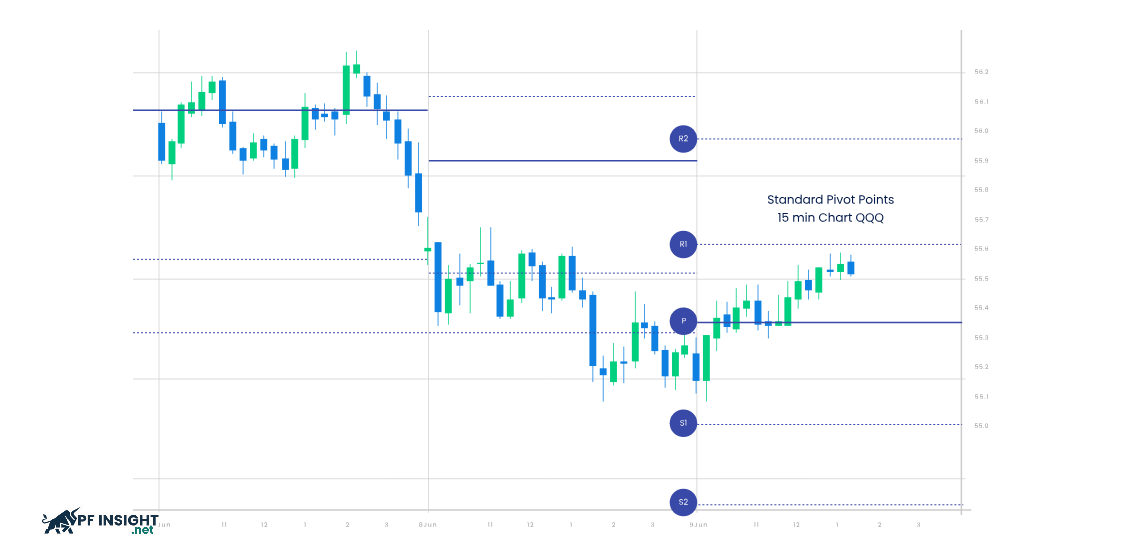
This is a traditional method, based on the high, low, and closing prices of the previous session for calculation. This indicator is popular and can be applied to most financial markets.
Fibonacci Pivot Points
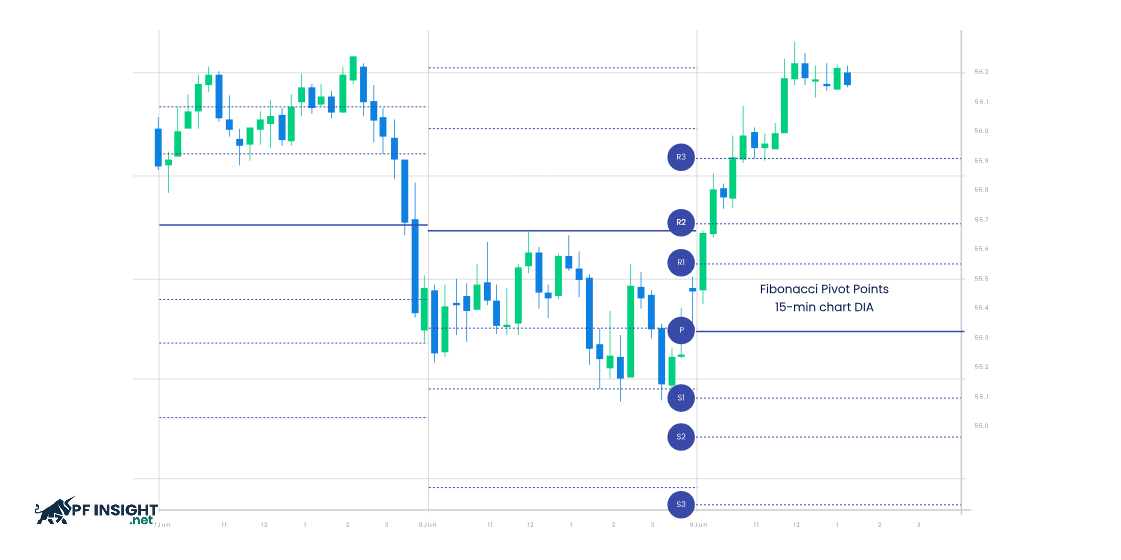
Pivot Points Trading, combined with Fibonacci retracement levels, increases the accuracy of predicting reversal points. Common ratios such as 38.2%, 61.8%, and 100% often identify key price zones. This method is particularly effective in trending markets when combined with Fibonacci extension levels.
Camarilla Pivot Points
Camarilla Pivot Points focuses on short-term price movements, with 8 clearly defined support and resistance levels. This method is particularly suitable for day traders and scalpers, helping to identify potential short-term reversal points.
Woodie’s Pivot Points
Prioritizing closing prices by assigning higher weights allows pivot levels to react more dynamically than the standard method. Because of this characteristic, Woodie’s Pivot is particularly suitable for high-volatility markets where closing prices carry significant predictive value. This method is often used by professional traders, especially those who focus on monitoring real-time price behavior rather than relying solely on historical data.
Pivot Point calculation formula
Pivot Points Trading is not a single element but is composed of multiple components. Each price level in the pivot system is calculated using a different formula, such as:
How to calculate Pivot Points (PP)
PP = (PHigh + PLow + PClose)/3
Calculation method 3 resistance levels
R1 = (2 x PP) – PLow
R2 = PP + (PHigh – PLow)
R3 = PHigh + 2(PP – PLow)
Calculation method 3 levels of support
S1 = (2 x PP) – PHigh
S2 = PP – (PHigh – PLow)
S3 = PLow – 2(PHigh – PP)
In there:
- PHigh: The highest price recorded in the preceding timeframe.
- Low: The lowest price level of the previous timeframe.
- PClose: The closing price at the end of the previous timeframe.
- PP: Pivot Point, which acts as the central reference level in the Pivot Points system.
The role of Pivot Points in trading

Pivot Points Trading operates on the principle that prices tend to fluctuate around the previous day’s closing price. Instead of expanding sharply beyond the previous range, the market returns to familiar price levels. Therefore, traders should set a 1D timeframe to ensure that the pivot levels for the new day are accurately calculated from the previous day’s closing data.
- Identifying trends: Pivot Points Trading is formed based on the high, low, and closing prices of the previous trading period. This allows traders to identify potential pivot levels, supporting trend analysis for the current trading session.
- Identifying Breakouts and Reversals: Pivot Points play a crucial role in identifying potential price levels for both breakout and reversal scenarios. When the price breaks through a key level, the trend usually continues to the next level. In the case of a reversal, the price may return to test the previous day’s price levels.
- Reflecting market psychology: Pivot Points Trading considers the impact of crowd psychology. When many traders apply the same Pivot Point system, price levels like R1, R2, or S1 become focal points for orders. In an uptrend, a large number of traders placing take-profit orders at R2 can cause the price to move to this level. Therefore, it is not the Pivot Points themselves that create reversals, but rather the market’s collective reaction at these levels that causes price fluctuations.
- Determining Take Profit and Stop Loss Points: Using pivot points helps traders easily set clear take profit and stop loss levels. Pivot points act as reference price levels, assisting traders in identifying appropriate exit points, reducing emotional impulses, and increasing discipline in trading.
- Minimizing lag: Pivot Points are a useful tool in trading strategies involving key price zones and channels, especially when combined with RSI, MACD, or volume indicators. While not a perfect indicator, Pivot Points are often used as an additional confirmation factor. The strength of Pivot Points Trading lies in its ability to closely monitor price movements around trading zones, minimizing lag compared to many other technical indicators.
Guide to trading on Pivot Points
Mastering pivot point trading methods increases the certainty of the overall strategy. Traders need to know how to interpret different pivot levels, from key pivot points to important support and resistance levels.

Analyzing price levels
- Pivot Point (PP): Consider the equilibrium level of the market. When the price trades above the PP, the trend is usually upward; conversely, the price below the PP indicates a downward trend.
- Resistance levels (R1, R2, R3): Represent potential high price zones where selling pressure may emerge as traders expect the price to struggle to break through.
- Support levels (S1, S2, S3): These are low price zones where buying pressure often increases as traders expect the price to be supported and rebound.
Price reaction at key levels
In Pivot Points Trading, prices can react in various scenarios at pivot levels. Price may bounce back upon touching a key level or break out to continue the trend. The R3 and S3 levels are considered infrequent. When price tests these levels, the reaction is quite strong, indicating that the market is in an overbought or oversold state.
Determine entry points, exit points, and stop-loss orders
Entry points: Prioritize opening buy orders when the price approaches S1 or S2 and shows signs of a potential breakout. Conversely, open sell orders when the price touches R1 or R2 and shows signs of rejection.
- Exit/Take Profit: For buy orders, R1 or R2 levels are typically used as take-profit targets. For sell orders, S1 or S2 are appropriate price target zones.
- Stop loss: Place the stop loss below the support zone for buy orders and above the resistance zone for sell orders to limit risk.
Top 4 Pivot Points Trading strategies
Pivot point bounce strategy
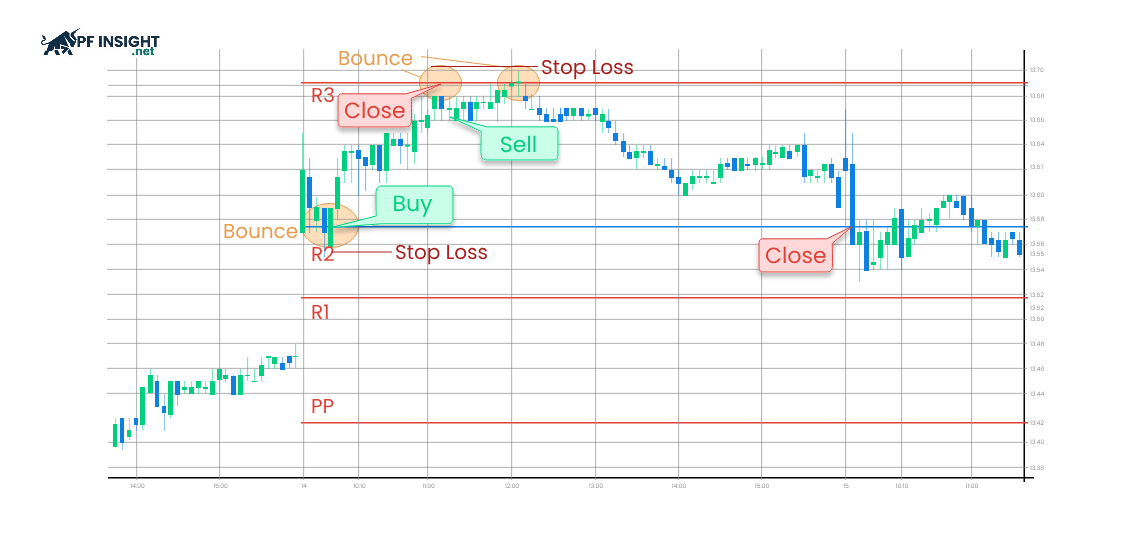
This reversal strategy focuses on observing the market’s reaction as price approaches key support or resistance zones identified by pivot points. When price reaches these levels but lacks the momentum to break through, it will begin to show signs of stalling and reversing direction. The price “bouncing” back creates a safe trading signal, allowing investors to capitalize on the price retracement to seek profits right at the beginning of the reversal wave.
- Buy entry: Wait for the price to correct to the S1 or S2 zone, then observe bullish candlestick patterns to confirm the possibility of an upward reversal. The stop-loss order should be placed just below the support zone to limit risk.
- Sell entry: Wait for the price to rise to the R1 or R2 area and look for bearish candlestick signals indicating selling pressure. Place your stop loss above the resistance zone to protect your account if the market moves against your expectations.
Note: This Pivot Points Trading strategy is most effective when the market is moving sideways or with low volatility, where prices often react clearly at support and resistance levels.
Pivot point breakout strategy
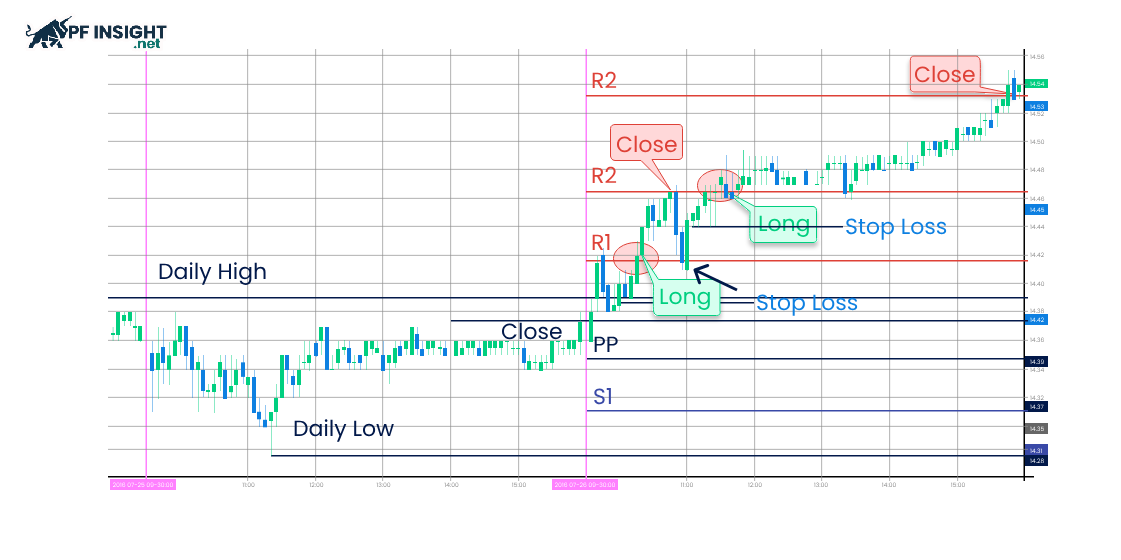
The pivot point breakout strategy is an extremely powerful trend-following trading method based on the principle of explosive money flow. When the price moves with a long candlestick body and decisively breaks through pivot levels, it indicates that either buyers or sellers have completely taken control of the market. This breakout often leads to a prolonged trend, allowing traders to enter the market right at the moment the momentum peaks to optimize profits according to the price flow.
- Buy entry: Observe when the price breaks decisively above R1 or R2, accompanied by increased trading volume to confirm buying pressure. Traders can enter a trade immediately at the breakout point. However, a safer approach is to wait for the price to retest the broken R1 zone before continuing its upward trend.
- Sell entry: Monitor for a clear price breakout below S1 or S2 with high volume confirming selling pressure. You can enter a trade immediately after the breakout occurs, or wait for the price to retrace and retest the broken S1 level before continuing to fall for a safer entry point.
Note: Pivot Points Trading is most effective in the early stages of a trend, when the price has just broken out of a consolidation zone and begins to move strongly.
Pivot point with RSI or MACD
When Pivot Points Trading is combined with oscillating indicators, traders can increase the accuracy of their analysis and filter out false signals. RSI and MACD are particularly useful tools for confirming trends and momentum.
- To confirm the potential for a price rebound, traders should wait for the price to correct to the S2 level while the RSI falls below 30. This indicates that the market is in an oversold zone, often accompanied by a high probability of a rebound or upward reversal.
- To confirm a valid breakout, traders should wait for the price to break above the R1 resistance level and for the MACD to simultaneously turn bullish. When the MACD crosses above the signal line, this indicates that new buying pressure is forming and supports a trend continuation scenario.
Note: Apply the RSI indicator to confirm the trend indicated by pivot levels, thereby minimizing the risk of false signals.
Intraday reversal using pivot with candlestick patterns
Candlestick patterns are tools that reflect trader behavior and psychology. When they form around pivot points, the signal strength is enhanced, effectively supporting day trading strategies.
- Bullish reversal signals: Prioritize observing candlestick patterns such as bullish pin bars or bullish engulfing patterns appearing directly at PP, S1, or S2 levels. The formation of these patterns indicates that buying pressure is dominant and the price is likely to reverse upwards.
- Bearish reversal signals: Look for bearish shooting stars or engulfing candlestick patterns forming at the PP, R1, or R2 levels. This indicates increasing selling pressure and that sellers are controlling the price movement.
Note: When combining Pivot Points Trading with candlestick patterns, traders can identify more reliable entry points. The pivot point represents a price range, while the candlestick provides confirmation signals to trigger trades.
Conclude
Pivot Points Trading provides traders with a clear analytical framework to identify key price zones, entry points, and manage risk effectively. When combined with technical indicators and price action, this method reduces noise and improves accuracy. According to PF Insight, Pivot Points Trading is a practical solution for traders who want to improve accuracy and better control risk.


