Parabolic SAR is considered a useful tool for identifying entry and exit points and managing trends. This indicator is particularly effective when the market has a clear trend, helping traders closely follow the upward or downward momentum of prices. Understanding how Parabolic SAR works correctly will help traders reduce signal noise and improve trading performance.
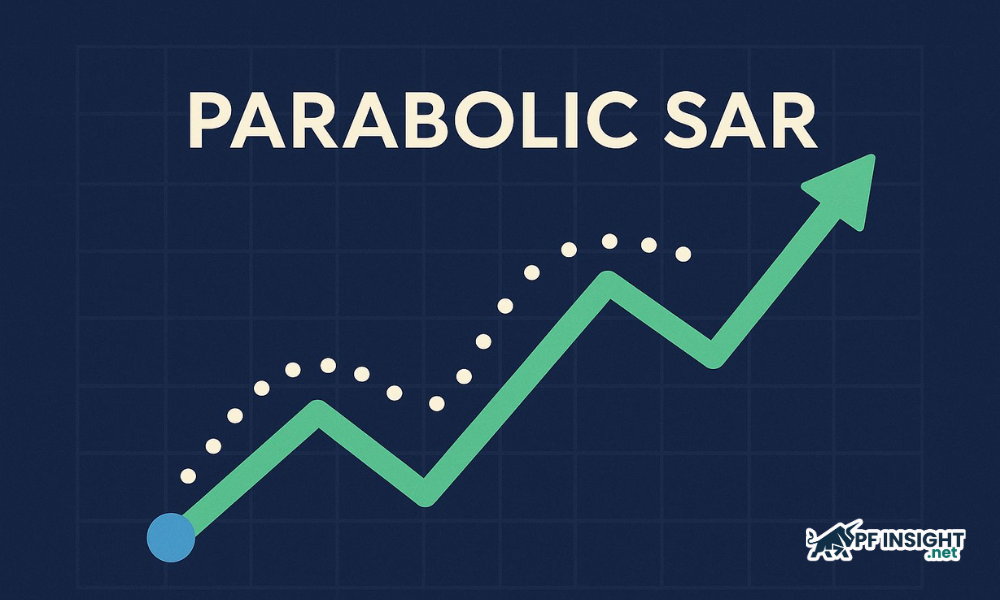
What is Parabolic SAR?
Created by Welles Wilder, the Parabolic SAR is a popular technical analysis tool that helps traders track market direction and identify reversal points. The Parabolic SAR is described as a parabolic price and time system. The term SAR stands for “stop and reverse,” reflecting the indicator’s primary function. In a prolonged trend, the SAR consistently tracks price movements.
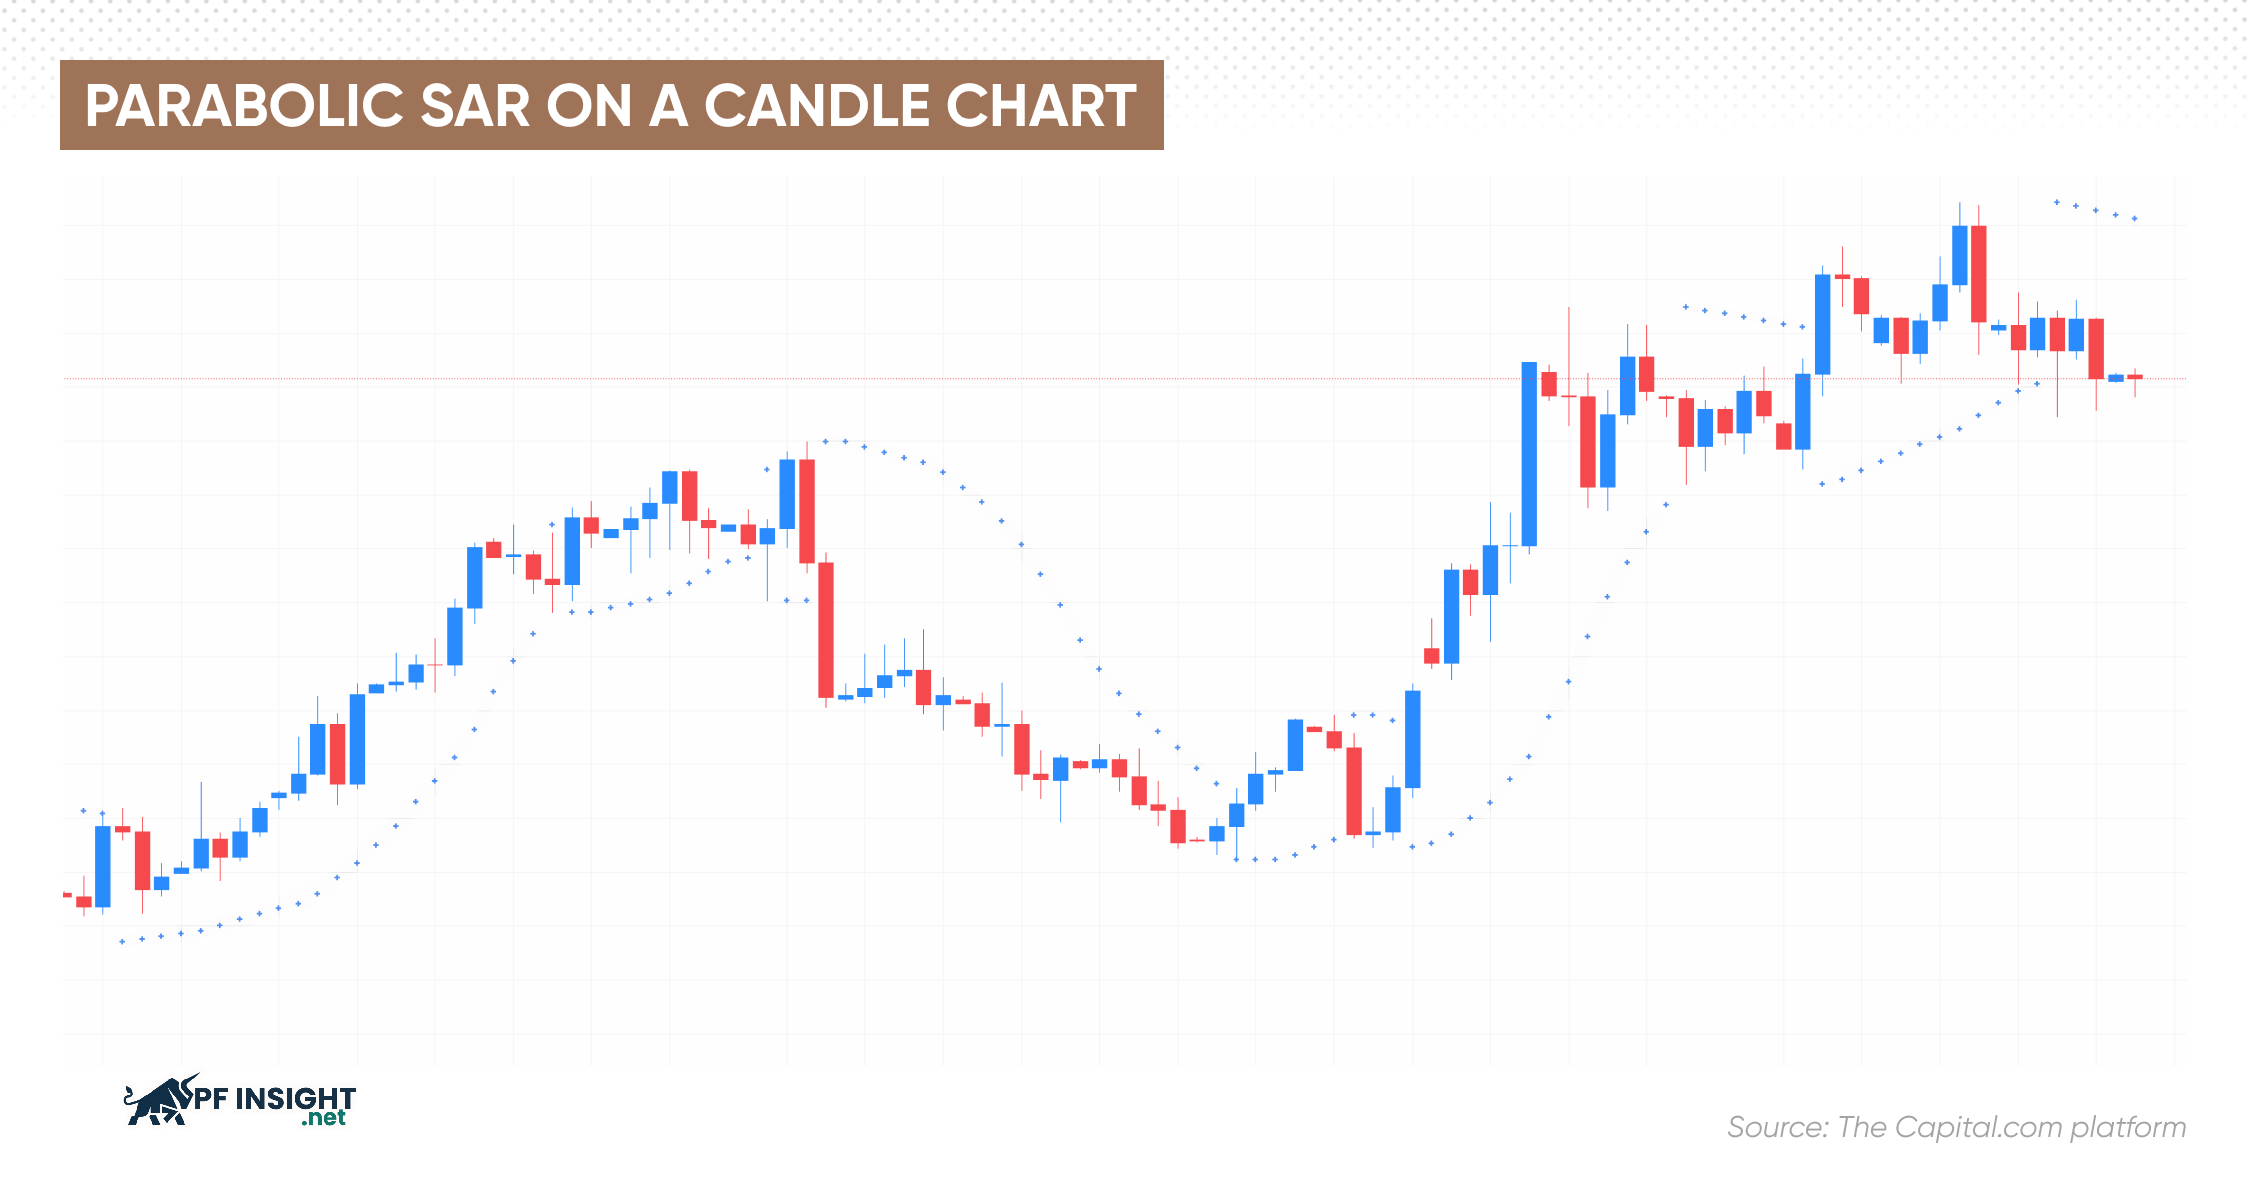
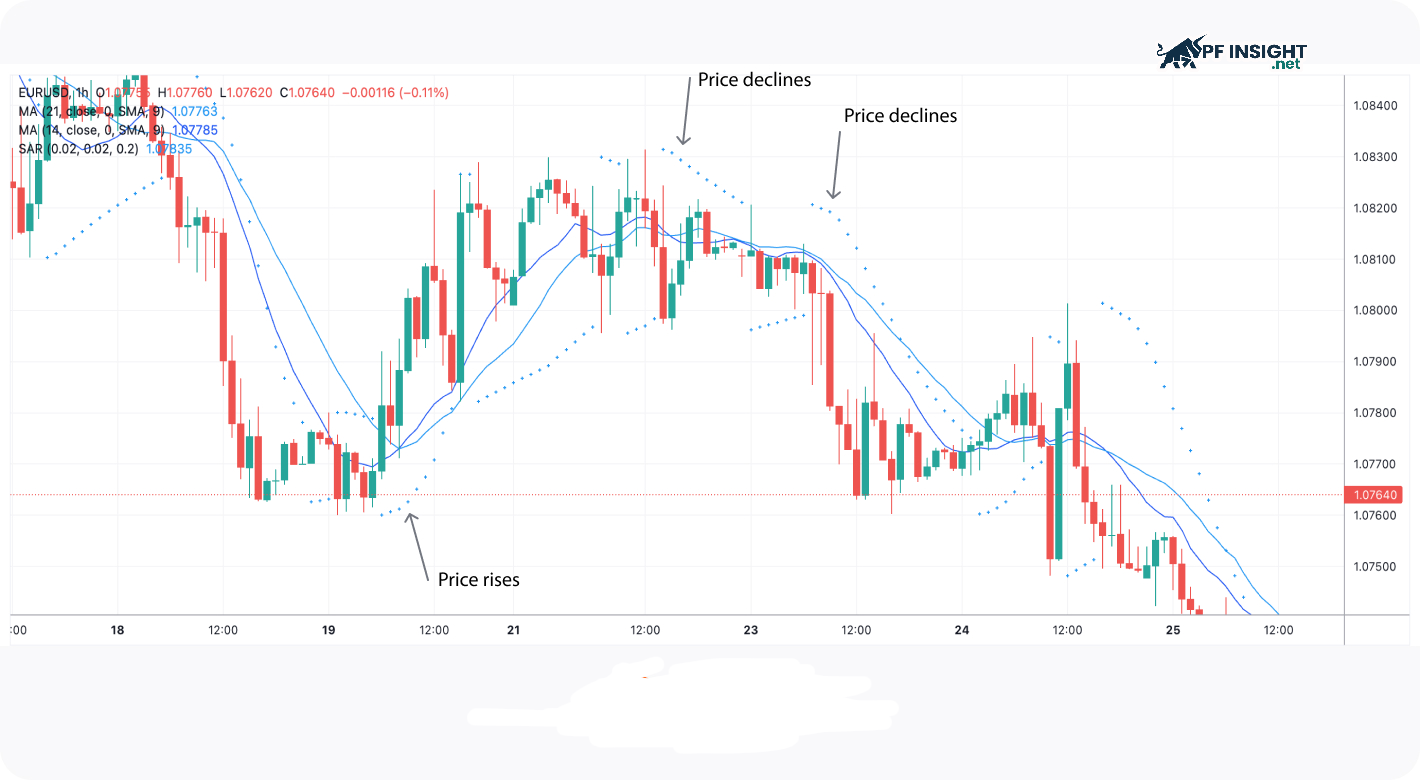
This indicator is represented by parabolic dots that move with the price movement. If the Parabolic SAR is below the price line, it usually signals that an uptrend is continuing. Conversely, when the dots appear above the price, the market is generally considered to be in a downtrend.
The Parabolic SAR was introduced by Welles Wilder in his 1978 book, “New Concepts of Technical Trading Systems”. Alongside the Parabolic SAR, the book also introduced other well-known indicators such as RSI, ATR, and the ADX directional movement system, which are still widely used today.
Formula for calculating parabolic SAR
Parabolic SAR identifies the positions of the dots based on the highest price, lowest price, and acceleration factor, thereby reflecting the direction and speed of the trend.
- Extreme points (EPs): EPs represent the highest or lowest price levels formed during a trend’s development, playing a crucial role in adjusting the sensitivity and effectiveness of the Parabolic SAR indicator.
- Acceleration factor (AF): AF is the parameter that determines the sensitivity of Parabolic SAR. AF starts at 0.02, increases by 0.02 with the formation of new EP, and does not exceed 0.20.
The formula for calculating Parabolic SAR is as follows:
SAR (today) = SAR (yesterday) + AF × (EP – SAR (yesterday))
In there:
- SAR (today): The current value of the Parabolic SAR.
- SAR (yesterday): The Parabolic SAR value of the previous session.
- AF: The acceleration parameter determines the sensitivity of the indicator.
- EP: The extreme price level of an ongoing trend, which could be the highest point or the lowest point.
Meaning of the Parabolic SAR indicator
Parabolic SAR generates trading signals based on the relationship between the indicator’s position and price movements. This allows traders to identify the appropriate time to enter or exit trades according to market trends.
Confirm the price trend
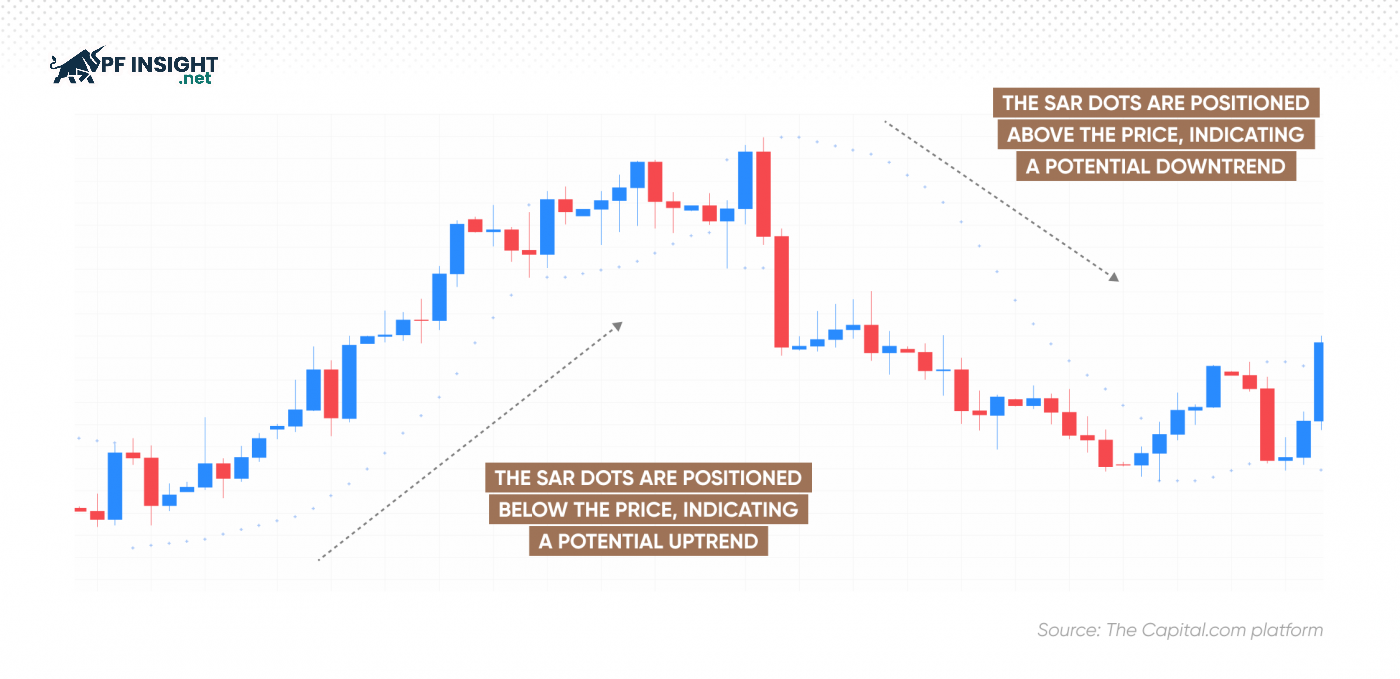
- Bullish signal: When the Parabolic SAR dots appear below the price line, the market is considered to be in an uptrend. This reflects dominant buying pressure, allowing traders to consider opening buy orders or continuing to hold current positions.
- Bearish signal: When the Parabolic SAR dots appear above the price line, the market is generally considered to be in a downtrend. This reflects dominant selling pressure, prompting traders to consider opening short positions or exiting current buy orders.
Identify market trends
Parabolic SAR is a useful tool for identifying upward or downward market trends. Based on the position of the dots relative to the price line, traders can assess the direction and strength of the current trend.
- Uptrend: The SAR dot is below the price line, reflecting the possibility of an upward market trend.
- Downtrend: The SAR dot is above the price, indicating that downward momentum is dominant.
- Strong trend: The gap between SAR and price is large, indicating a strong trend is underway.
- Weak trend: SAR closely tracks price, which could be a sign of a weakening trend.
Confirming a trend reversal
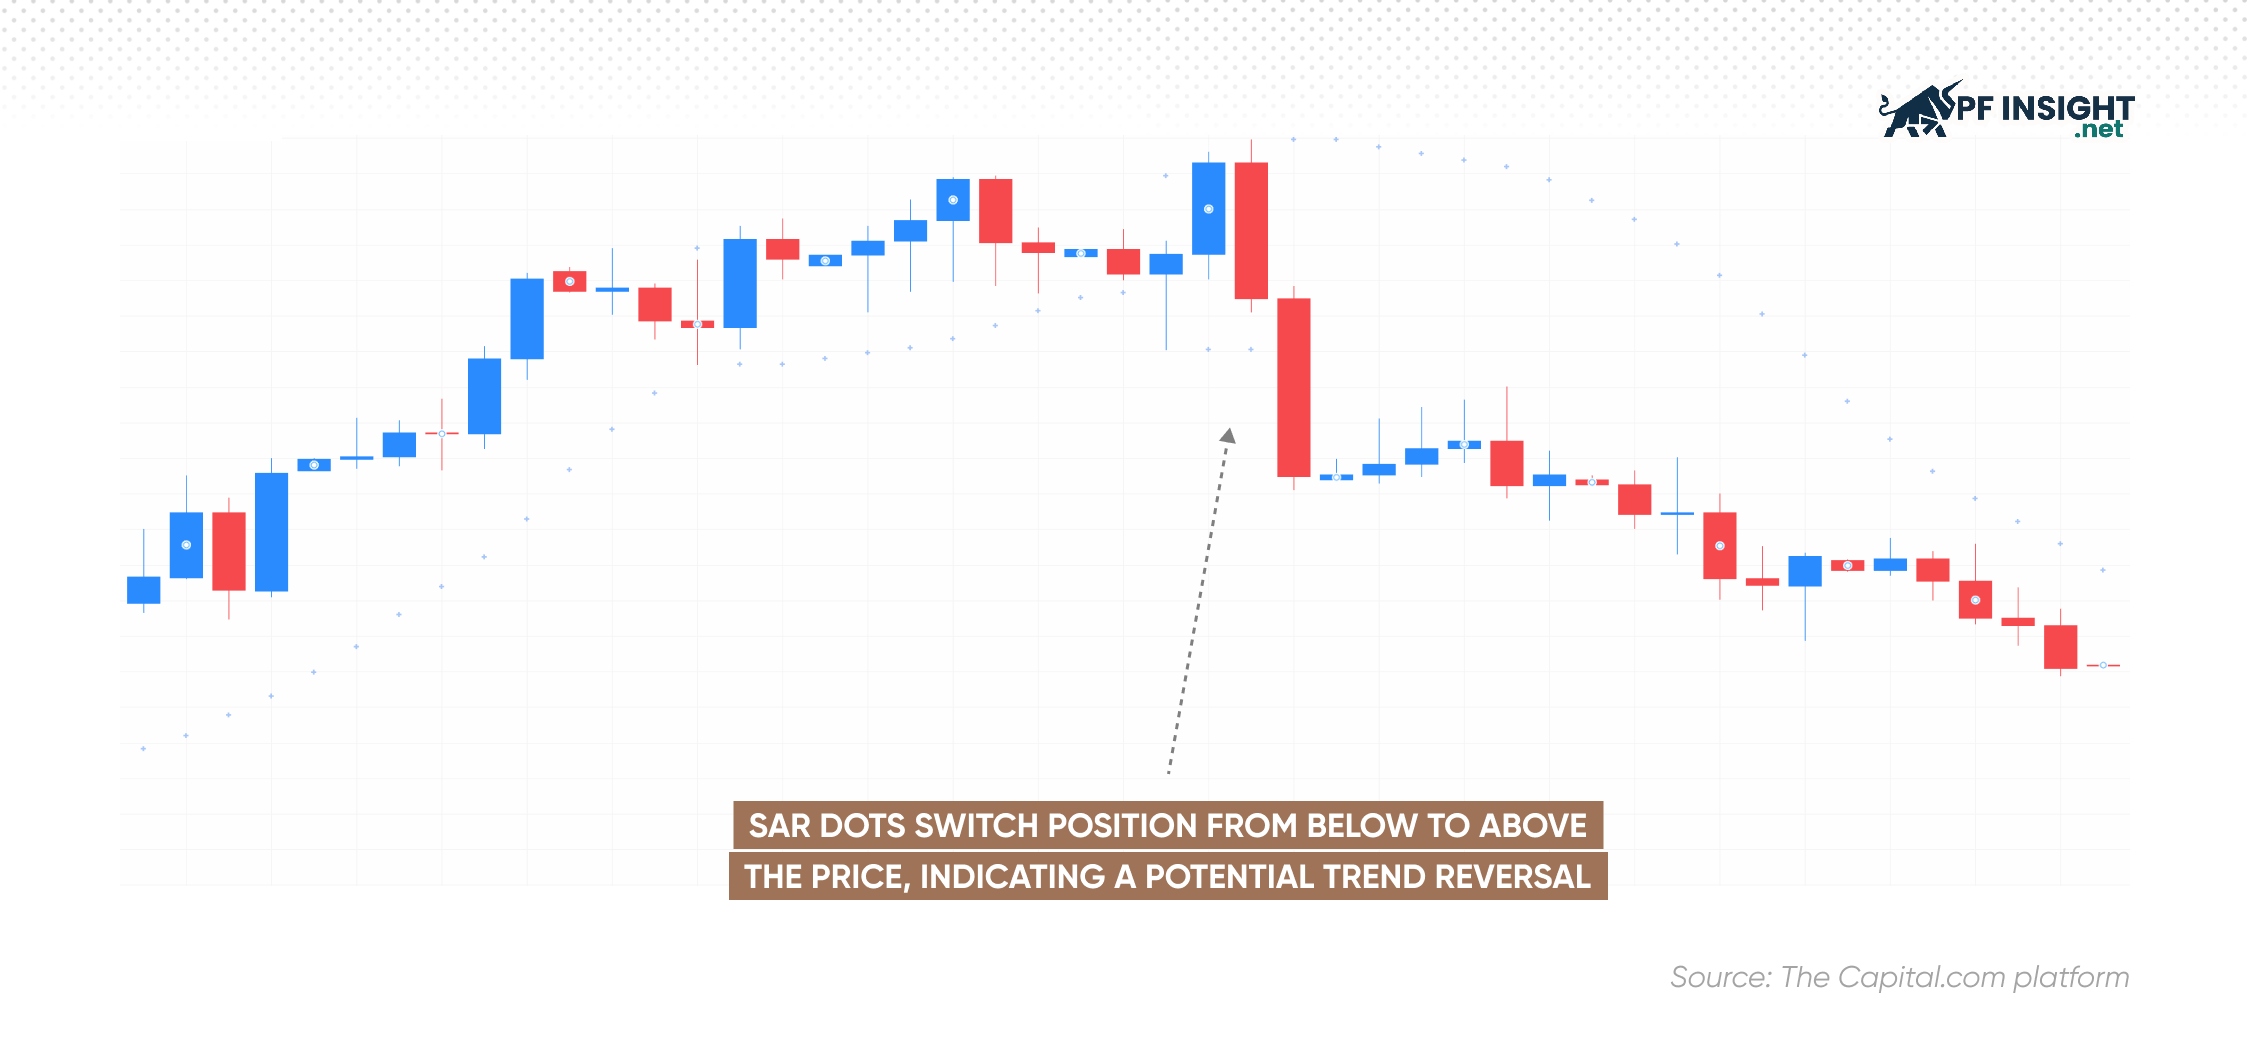
Parabolic SAR aids in reversal detection by tracking how SAR dots move around the price line. A shift in the indicator’s position from above to below the price, or vice versa, combined with a narrowing gap, can provide early warning of a potential trend reversal.
For example, when the Parabolic SAR moves from above the price line to below the price line, the market may be shifting from a downtrend to an uptrend. Conversely, if the SAR dots move from below the price line to above the price line, this is generally seen as a signal that the uptrend may be ending and reversing to a downtrend.
Advantages and disadvantages of Parabolic SAR
Advantages of Parabolic SAR
Quickly identify trends: Parabolic SAR helps traders visually and effectively identify the direction of price trends.
- Easy to observe and interpret: The indicator is represented by simple dots on the chart, making analysis easier compared to many other complex technical indicators. The position of the dot relative to the price clearly indicates whether the market is rising or falling.
- Supporting trading decision-making: Parabolic SAR provides signals that help traders identify when to open or close positions, thereby managing trades and controlling risk more strategically.
- Support for setting stop-loss orders: Parabolic SAR can be used to determine a reasonable stop-loss level, playing a crucial role in risk control and protecting trading capital.
- Flexible across multiple timeframes: This indicator works effectively in both short-term and long-term trading, suitable for a variety of styles and strategies.
- A systematic approach to trading: Parabolic SAR helps traders identify when a trend continues or reverses according to clear principles, thereby limiting emotional decisions.
Disadvantages of Parabolic SAR
- Effective in clear trends: Parabolic SAR is most effective when the market has a strong and stable trend. Conversely, in sideways or volatile conditions, the indicator may generate inaccurate signals.
- Prone to noise signals: When prices fluctuate continuously up and down within a narrow range, Parabolic SAR often generates multiple buy and sell signals in quick succession, making it easy for traders to execute unnecessary trades.
- Do not use alone: While useful in identifying trend reversals, Parabolic SAR can be misleading when used alone. Combining it with other indicators will help increase the reliability of the signal.
- Slow reaction in highly volatile markets: When the market moves quickly, Parabolic SAR may not keep up with price fluctuations, resulting in delayed trend confirmation or continuation signals.
- Parameter optimization is necessary: In both short-term and long-term trading, indicator parameters should be adjusted to suit each strategy. Using default settings sometimes does not yield optimal results in all market conditions.
Trading strategy using the Parabolic SAR indicator
Parabolic SAR is often used in conjunction with other analytical tools to increase signal reliability and determine the true strength of price trends. Below are four popular strategies commonly used by traders:
Parabolic SAR with moving averages
Using Parabolic SAR along with MA lines allows traders to assess the trend direction more clearly, thereby optimizing entry and exit points during trading.
When the price is below the long-term moving average, the sell signal from the Parabolic SAR is usually more reliable. A break below and sustained below the average indicates overwhelming selling pressure. When the Parabolic SAR simultaneously signals a bearish trend, traders may consider this confirmation of a potential further downward movement and consider opening a short position.
When asset prices are above long-term moving averages, bullish signals from Parabolic SARs are generally preferred. In a dominant uptrend, traders may consider opening buy positions and simultaneously using SARs to determine appropriate stop-loss placements.
The crossover of moving averages, especially when the short-term MA crosses the long-term MA, often signals a potential trend reversal. Combining this signal with Parabolic SAR helps traders detect market changes earlier and reduces lag compared to using SAR alone.
See more: Ichimoku cloud how it works in real trading
Parabolic SAR with Stochastic Oscillator
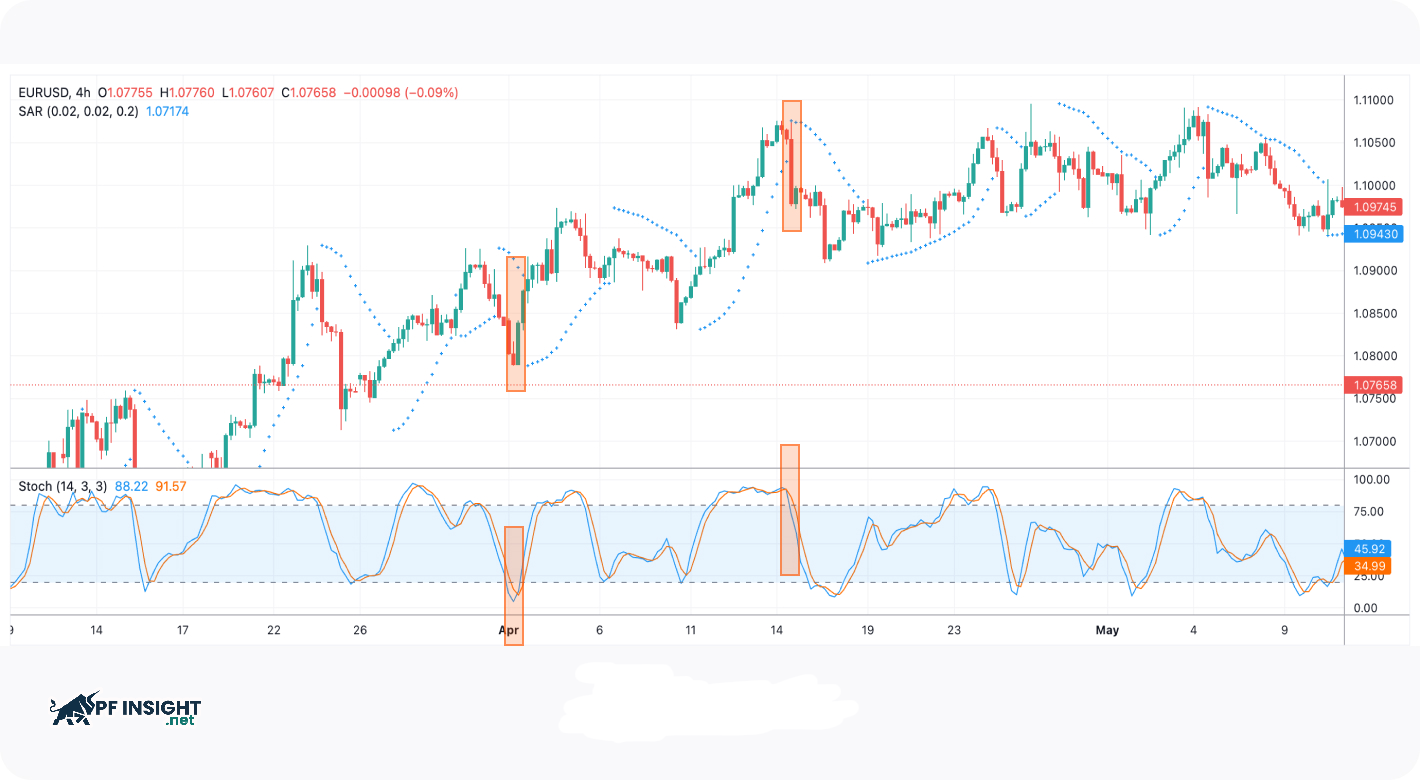
The Stochastic Oscillator helps identify when the price falls into overbought or oversold zones, often signaling a potential short-term reversal. Using this indicator along with the Parabolic SAR allows traders to filter out noise and more accurately confirm buy or sell entry points.
If the Parabolic SAR reverses from above to below the price, traders can use the Stochastic Oscillator for further confirmation. When the Stochastic Oscillator crosses above 20, it indicates that the asset has just exited the oversold zone. The coincidence of these two signals increases the reliability of the buy signal from the Parabolic SAR.
If the Parabolic SAR dots move from below to above the price, you should also check the Stochastic Oscillator indicator. When the Stochastic lines fall below the overbought zone of 80–100, it signals increasing selling pressure. When this signal coincides with a declining SAR, traders can be more confident in placing sell orders.
Parabolic SAR with RSI
The RSI indicator measures the strength of price volatility by analyzing the rate of price change, thereby helping traders identify overbought and oversold areas in the market.
Combination principle: If the RSI confirms an overbought or oversold state of the asset, while the Parabolic SAR signals an impending trend reversal, this is considered a strong signal to consider entering a trade.
Meaning: When Parabolic SAR and RSI both give a consensus signal, traders can more accurately assess the current market momentum. This combination is particularly useful in predicting the next price direction in potential reversal zones.
Parabolic SAR with ADX
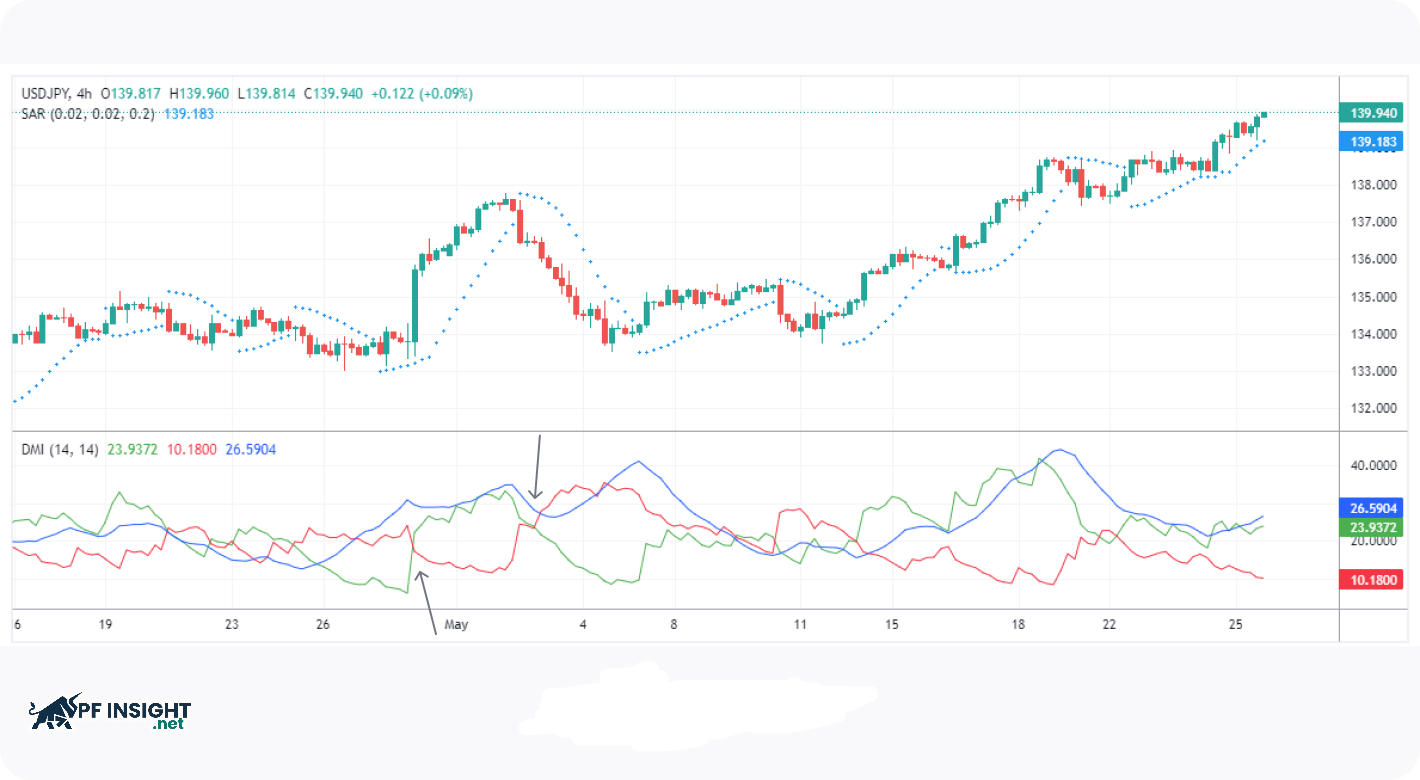
ADX is an indicator used to assess the strength of a market trend, with a scale from 0 to 100. When ADX is below 25, the trend is generally considered weak or unclear. This indicator is based on the DMI system, which consists of two lines, +DI and -DI. If +DI is above -DI, an uptrend prevails; conversely, the market tends to downtrend.
Combining Parabolic SAR with other indicator tools helps traders more clearly identify the right time to enter and exit trades. The synergy between these tools can improve the accuracy of trading decisions.
- Buy: When +DI is above -DI and ADX remains above 25, combined with the Parabolic SAR appearing below the price line at support or after a resistance breakout, this indicates that an uptrend is dominant and traders can consider opening a buy order.
- Sell: When -DI is above +DI and ADX exceeds 25, and the Parabolic SAR appears above the price line after the price reacts at a resistance zone or breaks through support, the market is usually confirmed to be in a downtrend, making it a suitable time to consider opening a sell order.
Important notes when using Parabolic SAR
Parabolic SAR is a popular indicator that helps traders identify trends and reversal points. However, to use it effectively, traders need to understand its limitations, suitable market conditions, and how to combine SAR with other technical tools.
- Always combine Parabolic SAR with trend confirmation or momentum indicators to increase signal reliability.
- Adjust the acceleration factor (AF) to match the level of market volatility, especially increasing AF when the market moves quickly.
- Avoid using Parabolic SAR in isolation during sideways market phases as it can easily generate noise signals.
- Applying Parabolic SAR as a tool to automatically identify and adjust stop-loss points in trend-following trades.
Conclude
Parabolic SAR offers an intuitive approach to identifying trends and optimizing stop-loss points; however, it should not be used alone. Traders need to understand market characteristics and adjust parameters accordingly. According to PF Insight, combining Parabolic SAR with momentum indicators will improve long-term trading performance.


