
For traders, understanding market conditions is essential when building a sustainable trading strategy. Overbought and oversold levels reflect the degree of market euphoria or panic, providing crucial clues about the likelihood of a trend reversal or continuation. Properly applying these levels helps traders improve timing and manage risk more effectively.
What are overbought and oversold levels?
Overbought
Overbought conditions occur when an asset’s price rises sharply and continuously over a short period, reflecting a clear dominance of buying pressure in the market. When the number of buy orders far exceeds the number of sell orders, the price is pushed above the equilibrium level. In this context, the upward momentum usually begins to weaken, increasing the likelihood of a correction or even a downward reversal in the following period.
Oversold
Oversold occurs when the price of an asset falls sharply and rapidly over a short period, indicating that selling pressure is dominant in the market. When supply far exceeds demand, the price is pushed below its equilibrium value. In this context, selling pressure usually gradually weakens, increasing the likelihood of a price rebound or an upward reversal in the next phase.
Causes that lead the market into overbought or oversold conditions
Markets falling into overbought or oversold conditions are not random occurrences, but usually stem from multiple factors simultaneously affecting supply, demand, and investor sentiment. Below are the most common causes:
- Economic news and unexpected events: Important information such as interest rate decisions, inflation data, employment reports, or geopolitical events can cause strong market reactions in the short term. When money flows in or out too quickly, prices can easily be pushed into overbought or oversold territory.
- FOMO (Fear Of Missing Out): FOMO causes traders and investors to chase prices when they have risen sharply, simply out of fear of missing out on an opportunity. This continuous buying pressure pushes prices far beyond their fair value, leading to a prolonged overbought condition.
- Panic sell: In contrast to FOMO, panic sell occurs when the market falls sharply and investors fear losses. Massive selling in a short period causes prices to drop unusually low, pushing the market into an oversold state.
- Low liquidity or high volatility: During periods of low liquidity, even a relatively large volume of buy or sell orders can cause significant price fluctuations. This often occurs outside of regular trading hours or in less active markets, increasing the likelihood of overbought or oversold conditions.
- Prices are pushed away from fundamental factors: When prices rise or fall primarily due to speculation, rumors, or short-term money flows without support from fundamental factors, the market is very likely to fall into an imbalance. This sets the stage for subsequent corrections or reversals.
Tools that help traders identify overbought and oversold levels
In technical analysis, traders often use various indicators to identify when the market is in overbought and oversold levels. These tools help assess price momentum and provide important clues about potential corrections. Below are some commonly applied indicators.
RSI indicator
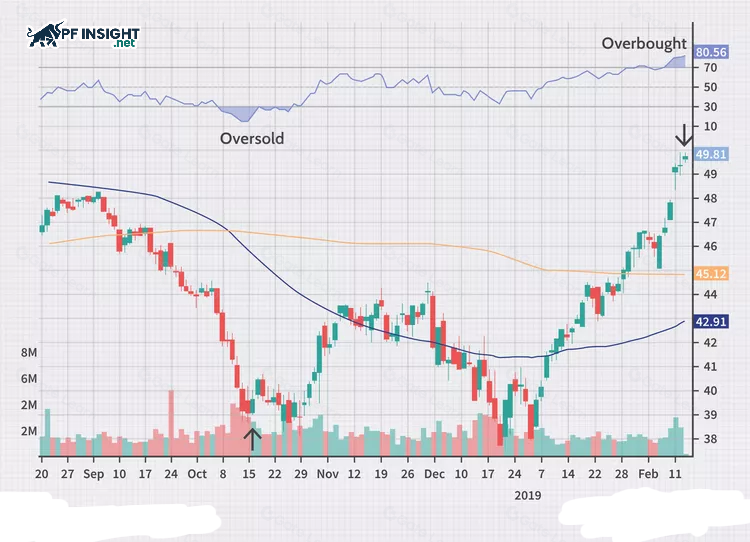
RSI is considered a standard tool for assessing overbought and oversold levels. This indicator operates within a range of 0 to 100 and uses common thresholds of 70 and 30. When the RSI moves above 70, the price may have overextended, while when the RSI falls below 30, a potential price pullback is often considered.
When the RSI enters the overbought or oversold zone, traders can monitor it for signals of potential price reversals. However, it’s important to note that in strong trends, the RSI can remain in these zones for quite some time while the price continues to follow the current trend.
Stochastic Oscillator indicator
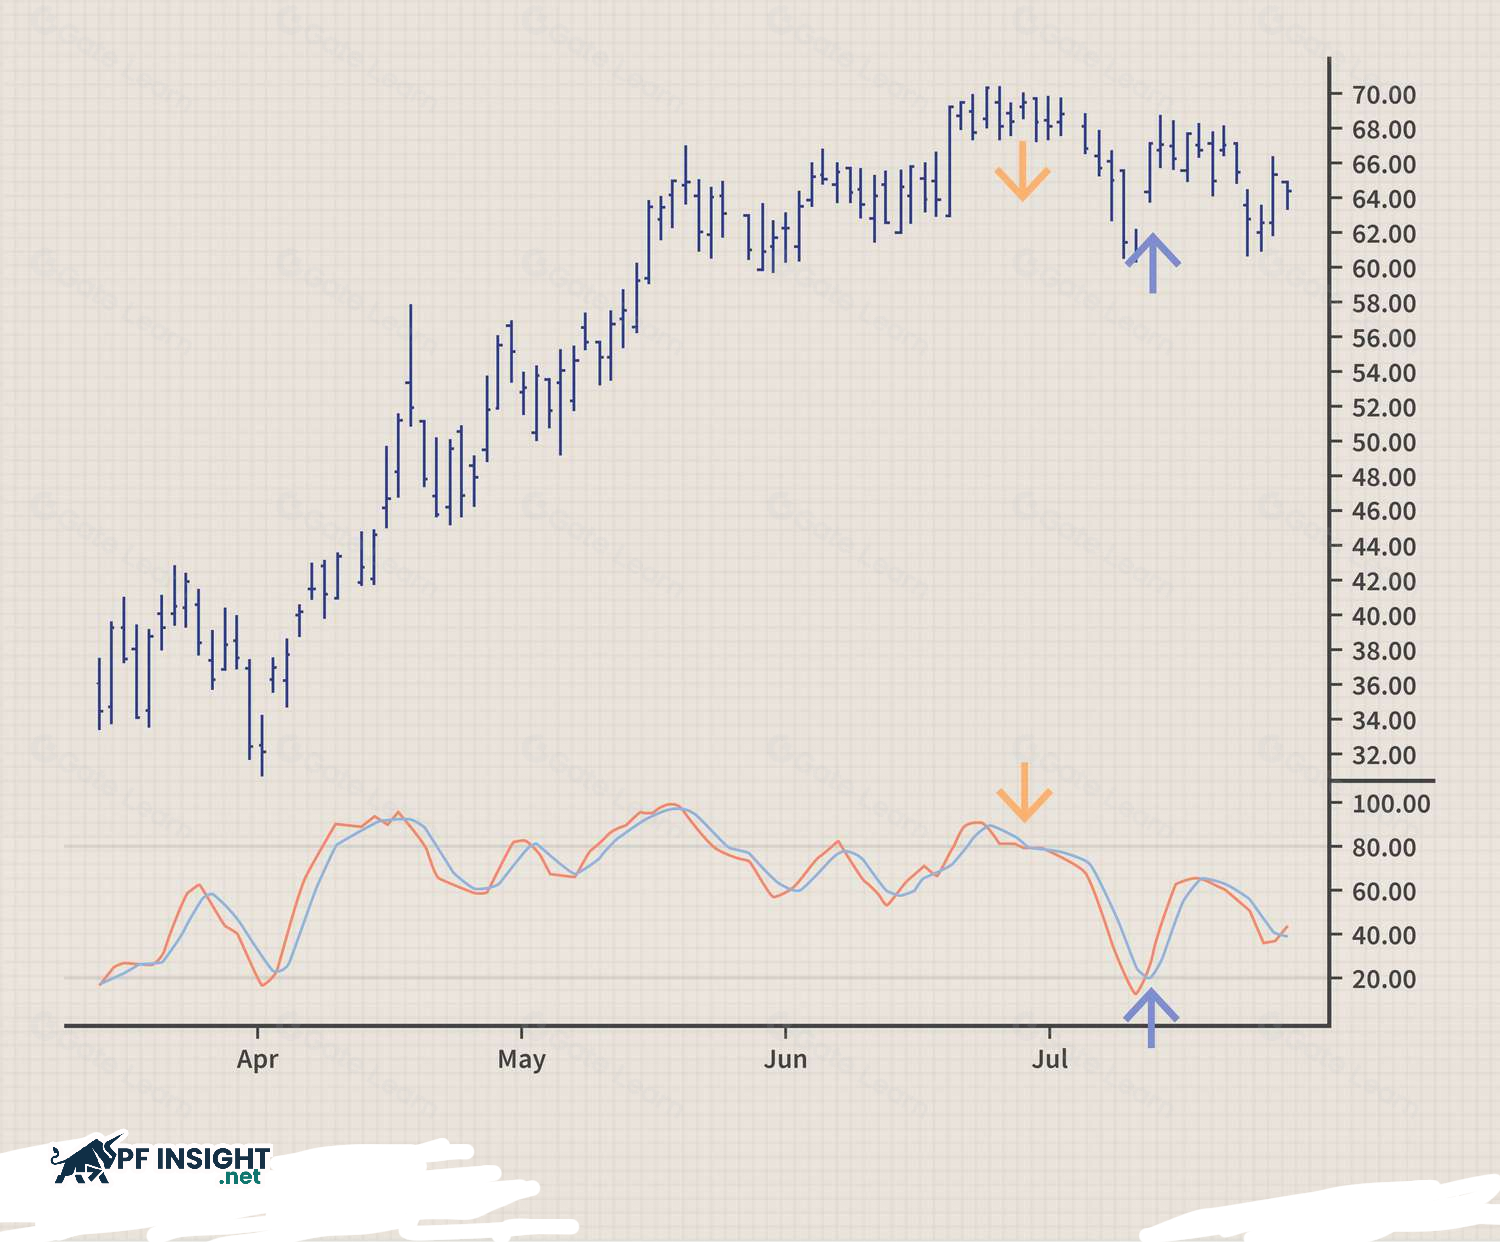
The Stochastic Oscillator is an indicator that measures the current closing price relative to the price range over a given period. This indicator operates within a range of 0 to 100 and typically uses two key thresholds: 80 and 20. When the Stochastic indicator rises above 80, the market is considered overbought, while when it falls below 20, the market is oversold.
The Stochastic Oscillator focuses on two key levels, 80 and 20, to identify overbought and oversold zones. Additionally, the crossover signal between the %K and %D lines provides further basis for traders to find suitable entry points, especially when it appears near key price levels.
See more: Support and resistance basics for traders learning technical analysis
MACD indicator
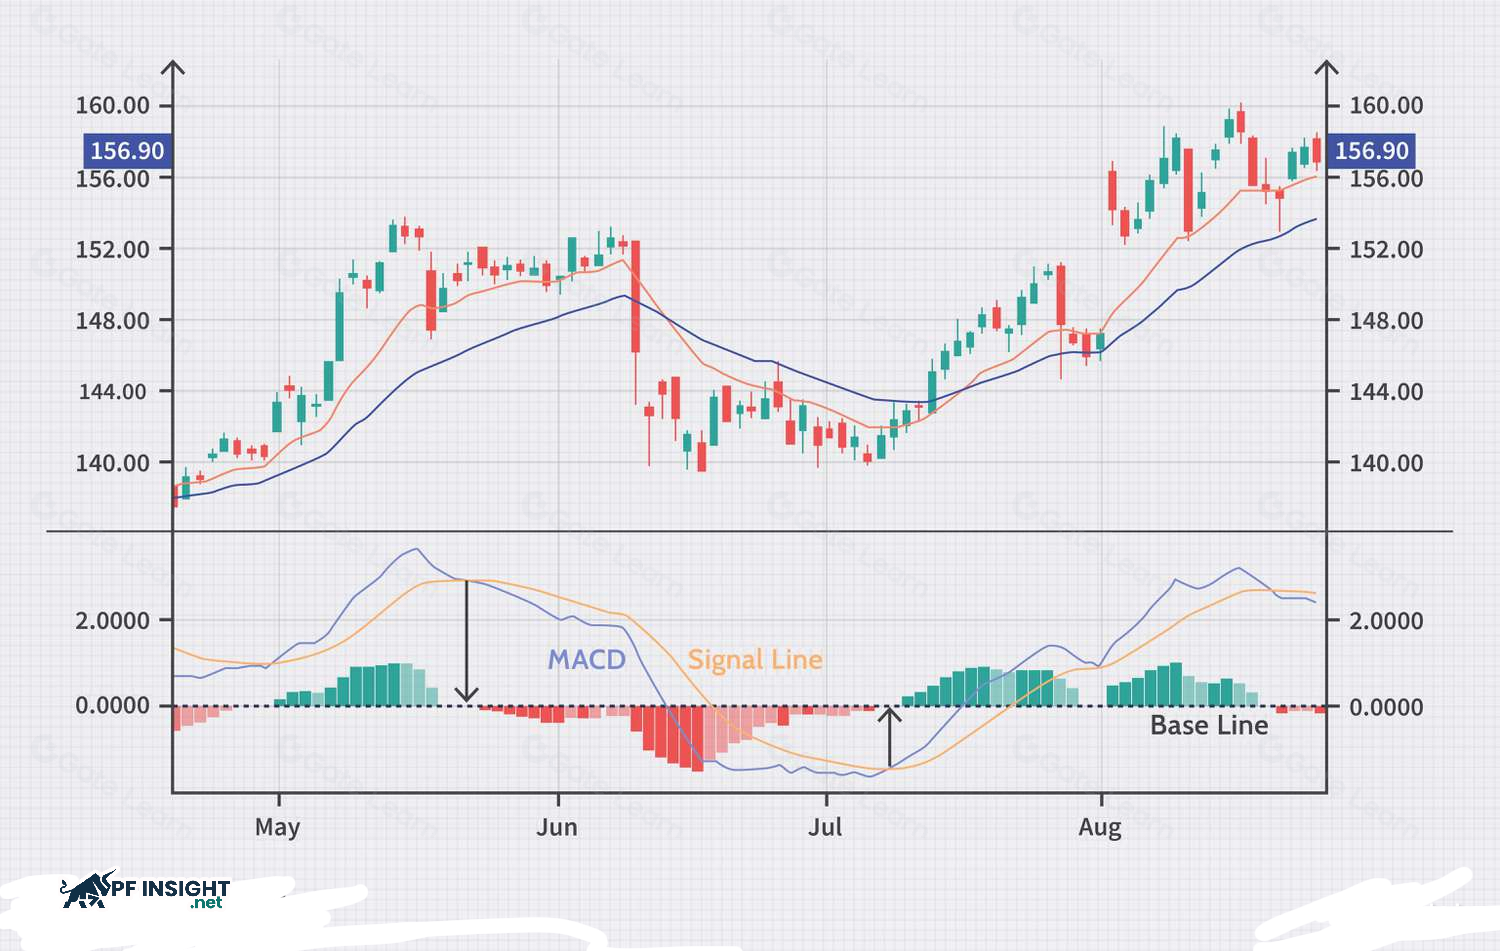
In technical analysis, the MACD helps traders identify the market direction and current trend momentum. The indicator’s structure consists of two main lines and a histogram to aid observation. A buy signal appears when the MACD line crosses above the signal line, while a sell signal forms when the MACD crosses below the signal line.
MACD is often used in conjunction with other technical indicators to increase the reliability of the analysis. Overbought and oversold levels. This indicator helps traders assess the strength and direction of a trend, thereby reducing noise signals during trading.
Bollinger Bands
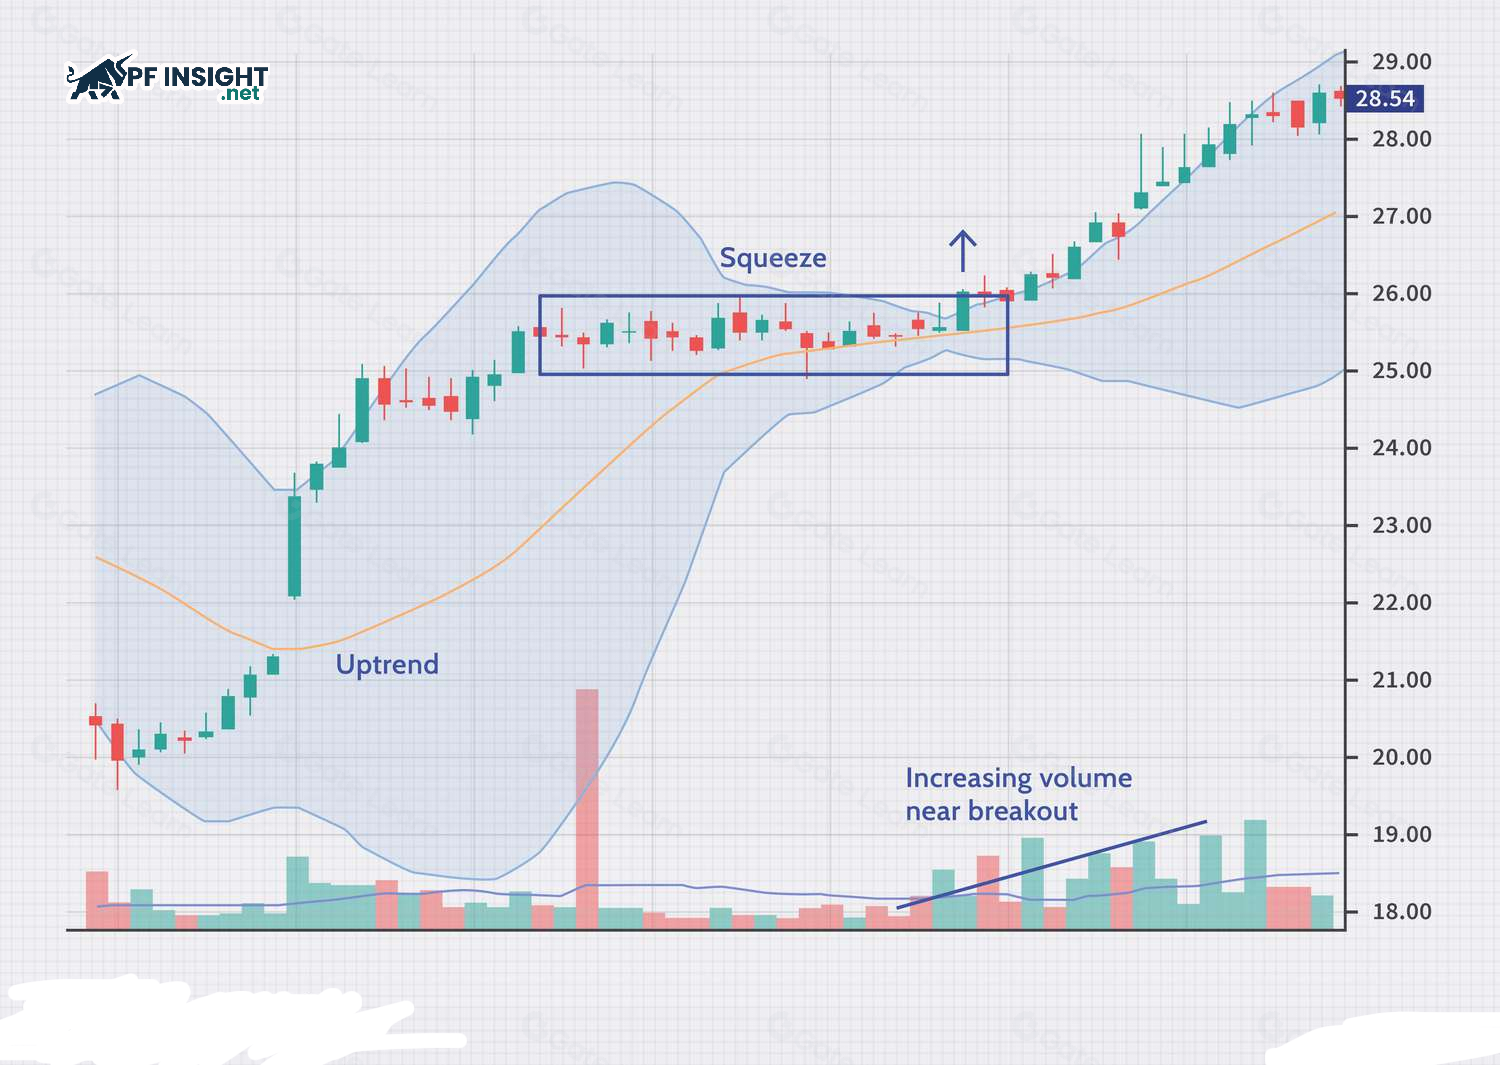
Bollinger Bands are an easy-to-use indicator often applied to identify overbought and oversold levels in the market. This tool functions as a three-line price channel, with the central line being a 20-day simple moving average.
When the price breaks out of the upper boundary of the price channel, the market may have risen too sharply and entered an overbought state. In this situation, the likelihood of a downward correction is quite high, creating favorable opportunities for sell orders.
Conversely, if the price breaks through the lower boundary, it indicates that selling pressure has prevailed and the market may be oversold, thus opening up expectations of an upward price recovery.
Traders should patiently wait for the candle to complete and close to confirm the signal before entering a trade. In overbought conditions, the price may break the trendline with an initial bullish candle, but a downtrend only truly forms when a clear bearish candle closes. Similarly, in oversold conditions, upward momentum is usually only confirmed when the first bullish candle completes.
Distinguishing between overbought and oversold markets
Although both overbought and oversold levels are warning signals that prices may be about to enter a correction phase, the core difference lies in the direction of movement they imply. An overbought state typically indicates that prices have risen too sharply and are likely to fall in the near future, while an oversold state reflects strong selling pressure and suggests a potential price recovery.
Similarities: Both overbought and oversold levels reflect a situation where asset prices are deviating from their fair value. In both cases, analysts typically conclude that the current price level is unsustainable and the market is likely to undergo a correction in the near future.
Differences: Below is a table comparing overbought and oversold levels:
| Overbought | Oversold | |
| Market sentiment | An overbought market typically shows increased selling pressure as participants take profits, leading to a gradual shift towards a pessimistic sentiment. |
The oversold condition reflects building buying pressure, suggesting that optimistic sentiment may be returning to the market. |
|
Reflecting asset value |
An overbought market typically reflects a situation where an asset is trading at a price higher than its fair value. |
An oversold market indicates that an asset is undervalued compared to its fair value, often due to strong short-term selling pressure. |
An overbought condition forms when buying demand spikes, disrupting the natural supply-demand balance. Prices rise rapidly but are not supported by fundamental factors or reliable technical indicators. This makes the current price appear inflated, reflecting a temporary imbalance rather than the true value of the asset.
An oversold market occurs when asset prices are pulled down too low relative to their intrinsic value. Common causes include strong selling pressure, stemming from pessimism or mass sell-offs, which cause prices to fall far below reasonable levels.
How to trade when the market is overbought or oversold
Traders typically employ two main methods when trading at overbought and oversold levels, depending on the market trend and the trading strategy being used.
Counter-trend trading strategies using overbought and oversold levels
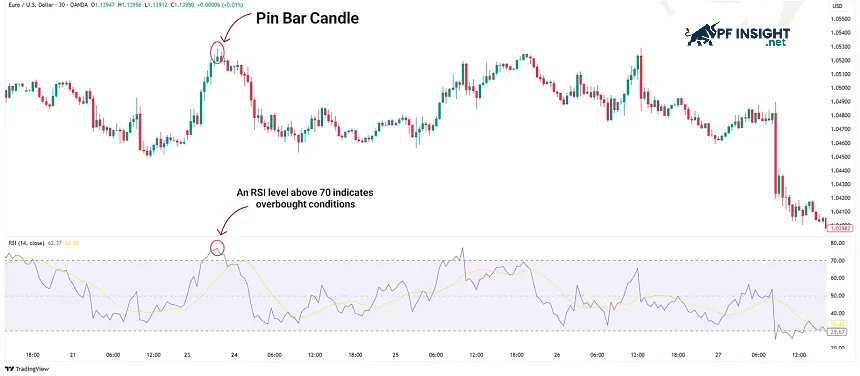
On the 30-minute chart of the EUR/USD pair, when a bearish pin bar candle forms at a key resistance zone, traders can begin planning a trade. The candle, with its long upper wick and small body, indicates strong selling pressure at the high price level. Simultaneously, the RSI exceeding 70 confirms the market is in an overbought state, increasing the probability of a bearish reversal.
How to execute the transaction:
- Sell: Open a sell order when the bearish pin bar candle closes completely, or when the price breaks through the bottom of the pin bar to confirm selling pressure.
- Stop loss: Place your stop loss above the top of the pin bar or above the nearest resistance zone to limit risk if the price continues to rise.
- Take profit: Set your profit target at the nearest support level, or use a minimum Risk:Reward ratio of 1:2 to optimize trading performance.
Combining candlestick patterns, resistance zones, and overbought RSI signals helps traders identify clearer entry points and better manage risk in counter-trend trading.
Continuing the trend after an overbought or oversold pullback
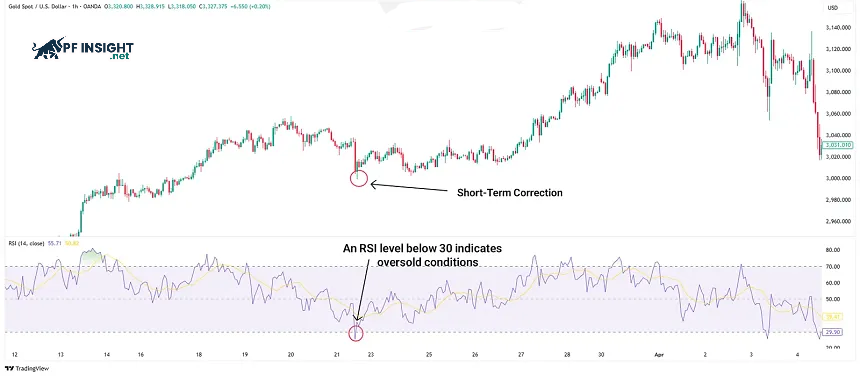
On the 1-hour chart of the XAU/USD (Gold) pair, the RSI fell below 30, indicating that the market was oversold. Given that the overall uptrend remained intact, this signal was interpreted as a short-term correction. Subsequently, the price quickly rebounded, confirming the end of the correction phase and the continuation of the uptrend.
How to execute the transaction:
- Buy: When the RSI exits the oversold zone and returns above 30, or when a bullish confirming candlestick (Bullish Engulfing, Bullish Pin Bar) appears at the support zone.
- Stop loss: Place your stop loss below the nearest low of the correction, or below a key support zone to avoid price volatility.
- Take profit: The target for taking profit is at the nearest peak in an uptrend. The target can be extended to the next resistance level, or a trailing stop can be used to maximize profit.
This trading method helps traders effectively capitalize on oversold periods in an uptrend while maintaining risk management discipline.
Common mistakes when applying overbought and oversold levels in trading
Here are some mistakes to avoid when trading overbought and oversold levels:
- Entering trades too early: Many traders believe that as soon as the market reaches overbought and oversold levels, the price will reverse immediately. In reality, the price may continue to move strongly in the current trend for a long time. Entering trades too early makes traders vulnerable to stop-loss sweeps or large drawdowns.
- Ignoring the overall trend: A serious mistake is trading against the main trend based solely on overbought or oversold signals. In a strong uptrend, the market can remain overbought for a very long time; similarly, in a downtrend, oversold conditions can persist. Failing to consider the overall trend significantly reduces the probability of success.
- Not setting a stop loss: Some traders believe the market is “overbought” or “oversold,” so they don’t need to set a stop loss. This is extremely risky, especially during periods of high volatility. Not having a stop loss can lead to significant losses if the price continues to move against expectations.
- Using only one indicator: Using only RSI, Stochastic, or Bollinger Bands without combining them with other tools can easily create noise signals. Overbought and oversold levels work most effectively when confirmed by a trend, price pattern, or additional technical factors.
Important considerations when trading at overbought and oversold levels
To trade effectively at overbought and oversold levels, traders need to carefully consider many important factors before making a trading decision.
- Seek confirmation signals: Before making trading decisions based on overbought and oversold levels, traders should wait for confirmation signals from other analytical tools. Price patterns, trend analysis, or volume indicators can help reinforce the assessment and clarify the possibility of a market reversal.
- Assessing the overall trend: The general market trend plays a crucial role in interpreting overbought and oversold signals. In a strong uptrend, prices may remain overbought for an extended period without immediate reversal. Conversely, in a downtrend, oversold conditions can persist. Therefore, trading in line with the main trend will increase the probability of success.
- Risk management: During periods of high market volatility, overbought and oversold signals are often accompanied by large price swings. Therefore, adhering to risk management discipline, such as always setting stop-loss levels and controlling trading volume, will help limit losses and protect capital more effectively.
- Choose the right timeframe: Overbought and oversold levels can vary depending on the timeframe used. Oversold conditions on the daily timeframe do not necessarily exist on the weekly timeframe. Therefore, identifying the appropriate timeframe for your trading objectives is crucial, especially when applying a multi-timeframe analysis approach from high to low.
Conclude
Overbought and oversold levels are important tools that help traders identify potential market corrections or reversals. According to PF Insight, these signals are more effective when combined with the overall trend, price patterns, and sound risk management. Understanding the true nature of overbought and oversold conditions will help traders avoid impulsive entry and improve long-term trading performance.


