Mean Reversion strategy for Prop Firm is a method used by many traders to take advantage of profits when the market price deviates from the long-term average value. The core of the strategy lies in identifying the moments when the price returns to the equilibrium zone, which is especially effective in a fluctuating market with clear support and resistance levels. In this article, PF Insight will analyze in detail the popular strategies, along with the advantages and disadvantages of applying Mean Reversion in the Prop Firm challenge.
What is Mean Reversion?
What is Mean Reversion?
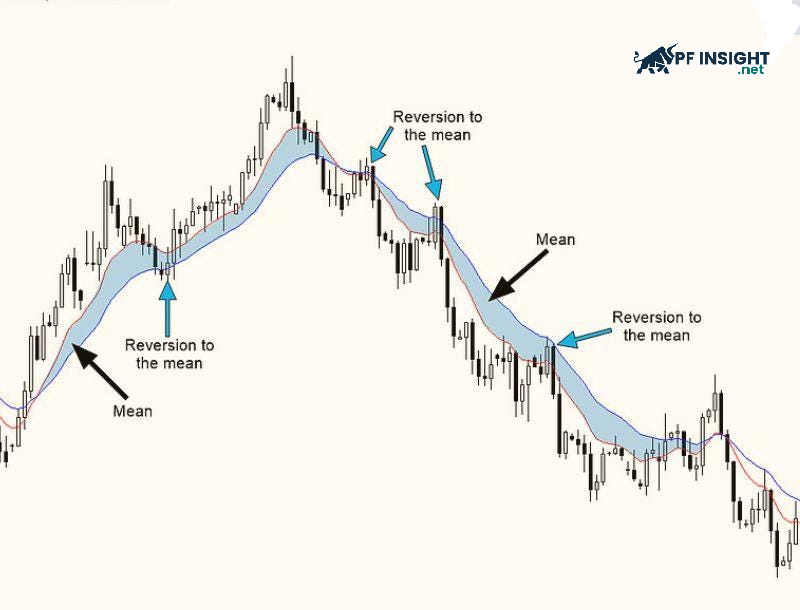
The Mean Reversion strategy is based on the assumption that asset prices tend to revert to their mean after sharp fluctuations. When prices rise too high, they tend to return to their equilibrium levels, and when prices fall sharply, they tend to bounce back. This average can be determined through a moving average (MA), VWAP, or a fair value zone established by the trader based on technical analysis.
The Mean Reversion strategy for Prop Firm is used to analyze multiple market factors including price, volatility, and technical indicators. Abnormally high or low asset prices indicate that the market has overreacted to a news or event. To find the best entry point, traders often buy when the price drops too low or sell when the price rises too high, with the expectation that the price will gradually return to a stable average level over time.
Additionally, market volatility can also be addressed with a mean reversion strategy. Traders often anticipate a return to normalcy by looking for periods of extreme volatility or extremely low volatility.
Guide to determining Mean Reversion strategy for Prop Firm
Guide to determining Mean Reversion strategy for Prop Firm
To use the Mean Reversion strategy for Prop Firm, a trader can rely on the following elements: Exit the mean after determining the mean, measure the deviation and wait for the price to return.
Define the mean: Mean Reversion strategy for Prop Firm can be detected using technical indicators such as SMA or EMA 20–50, intraday VWAP or moving average. Additionally, traders can measure deviation and normal price range with Bollinger Bands to determine more reasonable entry points.
Measure deviation: When the z-score reaches ±2, the RSI or Stochastic is below 30 or above 70, or the price moves more than 1.5–2 ATR from its average, you can identify extreme price expansion. These indicators often indicate that the market is oversold or overbought, with a potential reversal.
Add context: Add support and resistance zones to your trading context: Prioritize selling near resistance and buying near support. To maximize your entry points, combine volume and price action analysis, and before opening a position, look for reversal confirmation signals through increased volume and decreased volatility.
Confirmation signals: Take advantage of reversal patterns that indicate a reversion to the mean, such as bullish or bearish engulfing candles, pin bars, or RSI signals bouncing from 30 and MACD histogram reversing upwards. These are important signs that help traders recognize potential reversal points in the Mean Reversion strategy for Prop Firm.
Entry and exit points:
Entry point: Executed after the signal candle closes at the extreme zone, for example when the price returns inside the Bollinger bands.
First Exit: Take profit when price approaches the moving average (MA or VWAP).
Second Exit: Aim for the opposite band or next resistance/support zone.
Stop Loss: Place after the swing high or 1–2 ATR from the signal candle to control risk.
Risk management in trading: Your risk should be kept at 0.5–1% per trade. Keep your capital safe by exiting the trade promptly if the price does not move as expected. Always keep an eye on transaction costs, especially when using the Mean Reversion strategy for Prop Firm.
How to use technical indicators to identify Mean Reversion
How to use technical indicators to identify Mean Reversion
Traders use a variety of technical indicators to determine the Mean Reversion strategy for Prop Firm. By identifying when the price has deviated too far from the equilibrium value, these tools help predict trend reversals and establish more appropriate entry points.
Relative Strength Index (RSI): To determine the strength of a trend, the RSI oscillator compares recent gains and losses to measure price momentum. A market is considered overbought when the RSI is above 70, while a value below 30 indicates a possible oversold state, signaling a possible price reversal.
Bollinger Bands: This technical analysis tool consists of two standard deviation bands above and below, along with a moving average (MA). To help traders determine market conditions, these two bands act as dynamic resistance and support zones. Price movements outside these bands often indicate that the asset is oversold or overbought.
Stochastic Oscillator: This momentum indicator quantifies the correlation between the price range and the current closing price over a specific time frame. To determine the Mean Reversion strategy for Prop Firm, traders can identify overbought or oversold conditions.
Volume & Volatility Tools: A spike in volume or a reversal signal from OBV reflects a change in buying and selling pressure. When Bollinger Bands or ATR widen sharply, it is a warning sign of trend risk. Conversely, periods of low volatility often favor the Mean Reversion strategy for Prop Firm.
Moving Average Convergence Divergence (MACD): A trend-following momentum indicator, the MACD shows the relationship between two moving averages (MA) of an asset’s price. For market reversals or continuations, this tool provides early signals and helps traders identify changes in momentum and trend direction.
Note: No technical indicator is absolutely perfect. Therefore, to minimize risks and improve the effectiveness of the Mean Reversion strategy for Prop Firm, traders should combine multiple analytical tools to increase the accuracy and validate the signal before making a trading decision.
Top 6 Mean Reversion strategy help traders pass Prop Firm faster
The Mean Reversion strategy is most effective when applied according to clear and systematic principles. Below are 6 Mean Reversion strategies for Prop Firm that have been successfully used by many traders, helping you improve your risk management and optimize profits during trading.
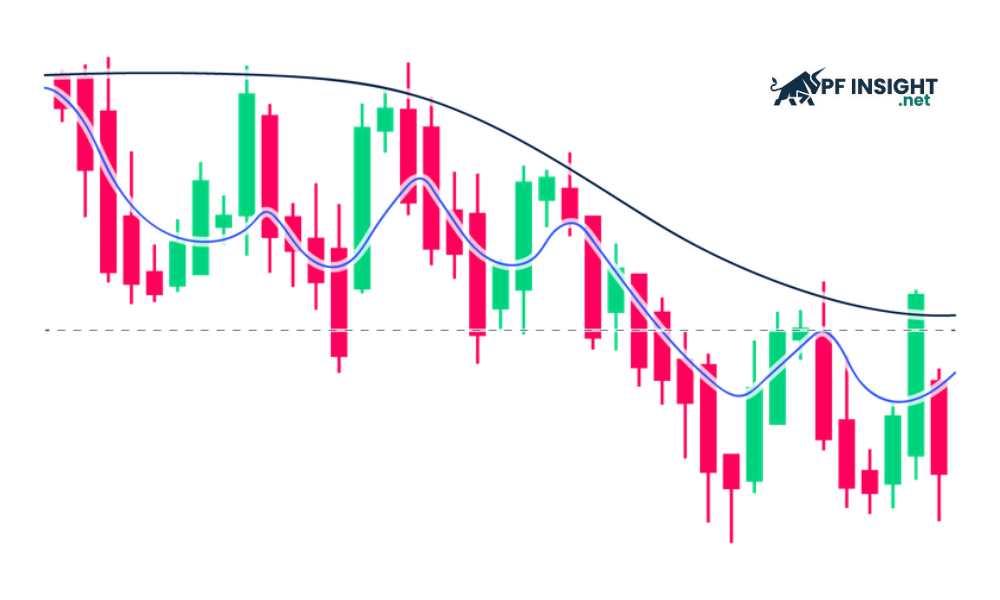
Moving Average Crossover strategy
Moving Average Crossover strategy
Moving Average Crossover strategy is one of the most popular methods in Mean Reversion strategy for Prop Firm. The core idea is to buy when the price crosses above the short-term average and sell when the price falls below the long-term average. This crossover shows that the price is returning to the mean, opening up favorable trading opportunities for the trader.
Trading rules:
Determine the 20 EMA and 50 EMA as the basis for the average price.
Entry point: After the price breaks the level, buy when the candle closes above the EMA 20 (for long buy orders) while the EMA 20 moves almost sideways.
Confirmation signal: A small bullish candle appears at the support zone or a bullish engulfing pattern appears after the correction.
Stop Loss: Set 1–1.5 ATR below the nearest bottom.
Exit order: When price touches EMA 50 or the middle of the previous range.
Note: Avoid trading when the EMA has a large slope, as it shows that the market is in a strong trend, which is not suitable for the Mean Reversion strategy.
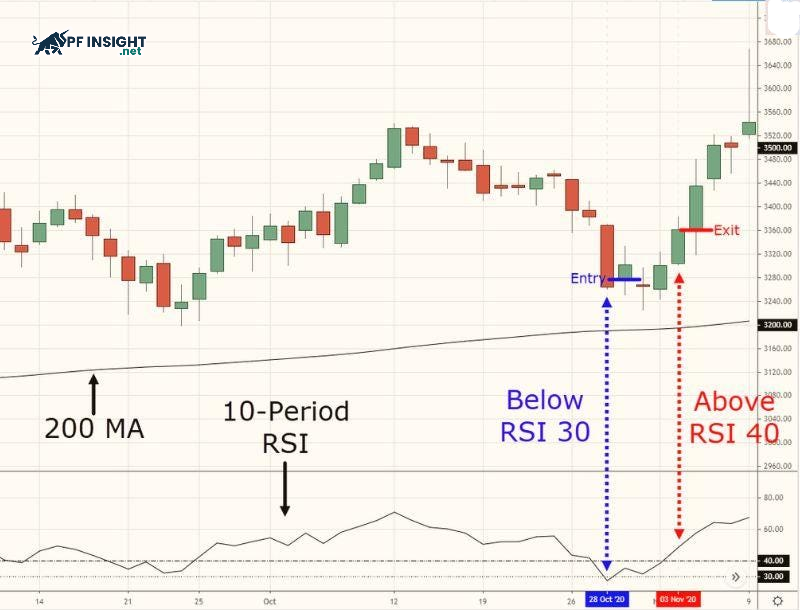
RSI and Stochastic reversion strategy
The RSI and Stochastic Reversion Strategy is a strategy that focuses on identifying extreme overbought or oversold areas and then capitalizing on the price correction back to the equilibrium zone. When the RSI crosses above 70 or the Stochastic crosses above 80, it could be a signal that the price is about to correct lower, whereas when both are below 30 or 20, the price is likely to bounce, providing an attractive mean reversion trading opportunity.
Trading rules:
Entry point: When RSI increases from below 30 to above or Stochastic’s %K line crosses %D in the area below 20.
Reversal Confirmation: Look for additional signals such as small body candles, long candle shadows showing price rejection, or slightly increased volume.
Stop loss: Place below the nearest bottom, about 1–2 ATR away.
Exit order: First target when RSI hits 50, second target around 20 EMA.
Note: The strategy may underperform in news-driven markets, low liquidity, or when a strong major trend prevails.
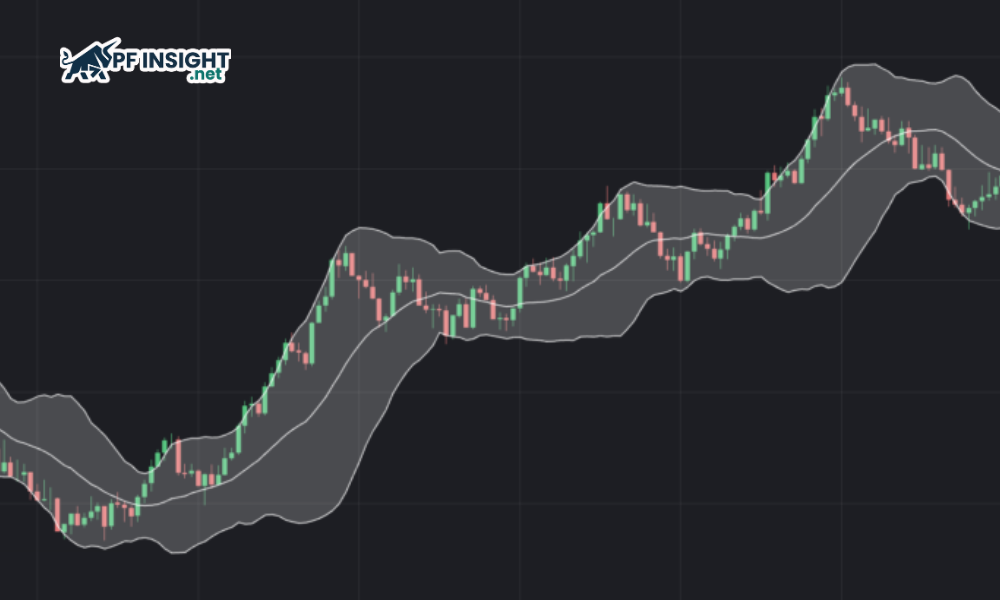
Bollinger Bands strategy
Bollinger Bands strategy
As one of the Mean Reversion strategies for Prop Firm, this method is based on the idea that prices tend to return to the center after touching the outer bands. When the price touches or exceeds the outer band, it indicates overbought or oversold conditions, whereas when the price returns to the inside of the band, it is a signal to trigger the order. Traders often combine confirmation from RSI or trading volume to increase accuracy.
Trading rules:
Entry point: When the closing price goes beyond the ±2σ band, then closes inside the Bollinger Bands – signal of a possible reversal.
Prefer trading when the Bollinger bands are flat and stable, rather than too narrow.
Stop Loss: Place outside the nearest extreme top or bottom.
Take Profit: At the midline (20-SMA), or extend the target to the opposite band if the rally is strong.
Note: Avoid trading when the Bandwidth increases rapidly, as it is a sign of a strong trend, not suitable for the Mean Reversion strategy for Prop Firm.
Pairs trading (Statistical Arbitrage)
This is a trading strategy based on the correlation between two assets. When one asset rises sharply while the other fails to keep up, the trader buys the weaker asset and sells the stronger asset, hoping that the price difference between them will narrow to an average, making a profit regardless of the overall market trend.
Trading rules:
Pair Selection: Prioritize highly correlated assets, such as two stocks in the same industry or similar ETFs.
Calculate the z-score of the price ratio between two assets.
Entry: Buy undervalued assets and sell overvalued assets when z-score exceeds |2.0| and then starts to reverse.
Stop Loss: Apply stop by time (e.g. 10 sessions) or when z-score exceeds |3.0|.
Exit order: When z-score returns to 0–0.5 range.
Note: Traders always check the volume and volatility of both assets and avoid trading during important news or earnings reports.
Fibonacci Reversion
Fibonacci Reversion
Fibonacci Reversion is based on the principle that strong price moves tend to revisit popular Fibonacci retracement levels such as 38.2%, 50% or 61.8%. When price extends beyond the average, traders anticipate a retracement to these areas to confirm supply and demand balance and look for opportunities to enter in the direction of the market.
Trading rules:
Identify the main impulse wave, then apply Fibonacci retracement levels to find potential entry zones.
Entry: At 38.2% or 50% when it coincides with the support/resistance zone and the 20–50 EMA band.
Confirmation signal: Combine with RSI signal recovering from 40-45 zone to confirm momentum reversal.
Stop Loss: Place below 61.8% or nearest bottom to limit risk.
Exit order: Take profit partially at the midpoint zone, the rest at the 20 EMA or the previous value zone.
Note: This method requires a liquid market, avoids strong news announcements and maintains discipline. Traders need to be patient and wait for a clear reversal signal before participating, because the Mean Reversion strategy for Prop Firm always requires strong confirmation.
Volatility Mean reversion
This Mean Reversion strategy for Prop Firm is based on the assumption that market volatility tends to revert to its mean over time. When volatility spikes, traders expect it to gradually decrease, whereas when volatility drops sharply, there is a high chance that it will bounce back.
Trading rules:
Apply ATR or Bollinger Bandwidth to track market volatility.
Entry Point: After a volume explosion but price does not go far (long tail candle, doji or clear reversal pattern), indicating that volatility is likely to cool down and return to the mean.
Stop Loss: If the price exceeds the amplitude of the abnormal movement.
Take Profit:ATR indicator returns to 20-period mean or price retraces to 20-EMA.
Note: A volatile environment can change unexpectedly, so you should set up a time-based exit mechanism to preserve profits.
Advantages and disadvantages of Mean Reversion strategy
Advantages and disadvantages of Mean Reversion strategy
Although, Mean Reversion strategy for Prop Firm brings many benefits to traders, it still has some disadvantages to note as follows:
Advantage
Easy to access and execute: Mean Reversion strategies have a simple structure, making them accessible to both new and experienced traders without the need for a complex system.
Time-tested: Numerous studies and real market data have proven the effectiveness of this method in exploiting price swing cycles.
Clear rules: Traders can easily define entry, exit and stop loss zones based on indicators such as RSI, Bollinger Bands or moving averages, making risk control more transparent.
Exploiting price deviations: When the market moves too far away from its true value, the Mean Reversion strategy for Prop Firm helps take advantage of the natural adjustment of price back to the equilibrium zone, providing a stable profit opportunity.
Disadvantages
No guarantee of future performance: While the Mean Reversion strategy can yield positive results in many market periods, changing economic conditions, monetary policy, and investor behavior can make this strategy less effective.
Risk when the market does not “regress”: Prices can continue to move away from the average zone for a long time especially when there is strong news or a big trend causing the account to lose money before the price returns.
Difficult to determine the “true equilibrium point”: The mean value is not fixed and changes depending on the time frame, indicators and market conditions. If the trader determines the “Mean” incorrectly, the entire strategy can be thrown off course.
Requires a strong mentality and the ability to control emotions: Mean Reversion strategy for Prop Firm often does not bring immediate results, forcing traders to patiently wait for confirmation signals and the moment when the price returns to the equilibrium zone. Maintaining discipline, avoiding early entry or exit due to fear is the decisive factor for the trader’s success.
In conclusion, the Mean Reversion strategy for Prop Firm offers attractive profit opportunities when the market fluctuates around the equilibrium zone, especially in the period of no clear trend. However, this method is not always suitable. Traders need to carefully evaluate the market conditions, capital management ability and their own risk tolerance before applying it to avoid unexpected losses.
Conclude
Overall, the Mean Reversion strategy for Prop Firm is a useful tool for taking advantage of market corrections, but it should not be used alone. It is more effective when combined with other methods such as trend identification, risk management, and volume analysis. When applied correctly with patience and discipline, this strategy can become a solid foundation in a long-term trading plan.