In financial trading, market imbalance zones are a crucial concept that helps traders identify price areas where a trend is likely to reverse or continue. These are areas where the market is imbalanced between supply and demand, often appearing after periods of significant volatility. Understanding and correctly applying market imbalance zones will help traders find optimal entry points with a better risk-reward ratio.
An imbalance zone is a special price area on a chart where the market moves quickly and lacks balance between supply and demand. Within this area, price often bypasses many trading levels, creating a reasonable gap in value. Due to low trading volume, the imbalance zone is considered a potential area that price may retest in the future.
Market imbalance zones appear when the flow of orders in the market is no longer balanced. A large concentration of buy or sell orders, combined with low liquidity on the opposite side, causes a strong price reaction. In cases where the number of buy orders significantly exceeds sell orders, the price of an asset such as a currency or stock often rises rapidly, forming a distinct imbalance zone.
What causes market imbalance?
What causes market imbalance?
Market imbalance zones typically appear after periods of stable price movement within a given trend, reflecting the accumulation of positions by large institutions. These entities include investment funds, banks, and professional financial institutions. Their large-scale position accumulation creates a noticeable imbalance in the market.
Market movements are the combined result of many different participating groups, not just large institutions. Market makers play a role in coordinating liquidity by continuously adjusting the order system. In addition, large-capital investors and traders also contribute significantly to buying and selling pressure. These groups sometimes cooperate in the same direction, but at other times they oppose each other, making the market structure more complex.
Following economic announcements or geopolitical events, the market often experiences sharp price movements leading to market imbalance zones. This reflects changes in the balance of international capital flows, as capital flows into surplus countries and out of deficit economies. This disparity creates uneven buying and selling pressure and forms distinct imbalance zones on the chart.
When the market receives shocking news, prices often react quickly and create imbalances. This information causes investors to readjust how they value assets, leading to sharp price shifts. The influencing factors can stem from corporate earnings results or significant fluctuations in the overall economic landscape.
Corporate financial reports: The release of business results can drastically alter investor expectations. For example, when quarterly reports exceed forecasts, buying pressure often increases rapidly, causing the market to become imbalanced and trend towards price increases.
Internal corporate events: Significant changes such as bankruptcy, leadership changes, mergers, or acquisitions often create substantial volatility. This information directly impacts market confidence and can cause stock prices to deviate from their initial equilibrium.
Policies and regulatory decisions: Actions from the government or regulatory agencies have a far-reaching impact on financial markets. For example, when the US Federal Reserve raises interest rates, selling pressure often appears on indices and stocks, leading to noticeable imbalances.
Geopolitical factors and natural disasters: Events such as geopolitical conflicts, regional crises, or unexpected natural disasters can disrupt economic activity. This causes rapid changes in market sentiment and creates areas of price imbalance in the market.
When the market adjusts from a previous equilibrium price to a new equilibrium price, the flow of orders is often no longer evenly distributed. This shift causes a temporary imbalance between supply and demand, creating a state of disequilibrium during the formation of the new price.
How to identify market imbalance zones on a price chart?
Traders can identify market imbalance zones by observing price structure, volatility, and the distribution of buy and sell orders on the chart. Specifically:
How to identify market imbalance zones on a price chart?
Identify large-bodied candles with short wicks
When analyzing price charts, traders should pay attention to candlesticks with long, clear bodies. These candlesticks often appear during periods of strong price movement in a single direction. This indicates the formation of market imbalance zones, reflecting a significant difference between buying and selling pressure in the market.
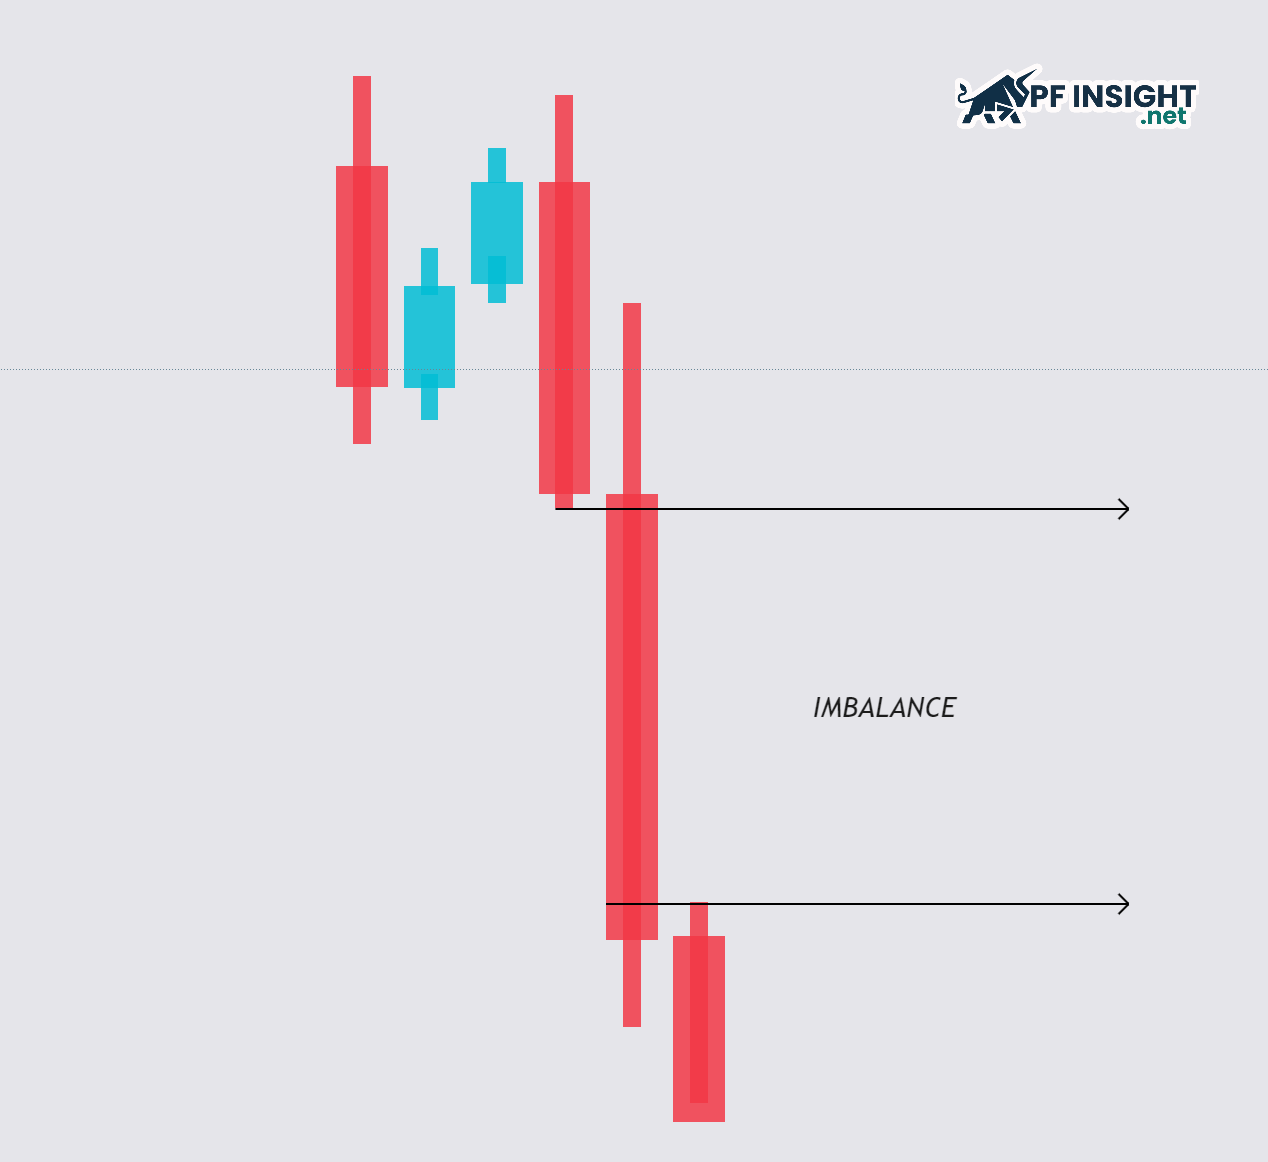
Recognize gaps between the wicks of adjacent candles
Traders should pay attention to price zones that lie above the candlestick body without being touched by the wicks of adjacent candlesticks. This indicates a lack of interaction between buying and selling pressure during that period. The result is low trading volume, reflecting a clear imbalance and offering valuable analytical insights.
Bullish candlestick: When a strong bullish candlestick appears, the upper body of the candlestick is usually separate and not touched by the wicks of the preceding or following candlesticks. This indicates a clear dominance of buying pressure during that period.
Bearish candlesticks: Conversely, a bearish candlestick will have a lower body that is not covered by the adjacent candlestick’s wick. This indicates that selling pressure is dominant and the market is moving rapidly without balance between the two sides.
The role of non-overlapping price zones
When the market creates non-overlapping price zones, it indicates that one side has completely dominated for a short period. Such areas are often called market imbalance zones, representing a state of supply-demand imbalance. This can result from strong buying and selling activity by large investors, leaving price gaps that tend to be filled in subsequent corrections.
Bullish Imbalance: A bullish imbalance forms when buying pressure completely overwhelms buying, causing prices to rise rapidly and leaving areas where sellers haven’t fully entered. These areas reflect an imbalance tilted in favor of buyers.
Bearish Imbalance: A bearish imbalance occurs when selling pressure clearly dominates, pushing prices down sharply and creating areas where buying power is insufficient to respond in time. This indicates an imbalance leaning towards the selling side of the market.
Effective trading strategies using imbalance zones
Below are effective trading strategies for market imbalance zones, helping traders optimize their risk-reward ratio and trade with large cash flows.
Effective trading strategies using imbalance zones
Trend following trading strategy
The trend-following strategy focuses on trading in line with the main market trend. First, traders need to identify the uptrend or downtrend on a larger timeframe for a clear context. Then, they move to a smaller timeframe to find market imbalance zones forming in the same direction as the trend. When the price corrects and returns to these zones, traders can consider entering trades in the direction of the main trend.
How to execute the transaction:
Entry: Traders should patiently wait for price corrections and a return to market imbalance zones before entering the market. Here, they should observe confirmation signals such as reversal candlestick patterns, rejection candlesticks, or signals from technical indicators, such as RSI divergence, to increase the reliability of the entry point.
Stop Loss: The stop loss level should be placed outside market imbalance zones to limit risk. For buy orders, the stop loss is usually located below this zone, while for sell orders, the stop loss is placed above to protect the account against adverse price movements.
Take Profit: The profit target can be determined at the nearest support or resistance levels. Alternatively, traders can also take profit based on a planned risk-to-reward ratio, such as 1:2 or 1:3, to ensure long-term trading effectiveness.
Counter-trend trading strategy
With a counter-trend strategy, traders observe how price reacts at key market imbalance zones. After a sharp price move and return to an imbalance zone, the inability to break through this zone indicates that opposing forces are beginning to emerge. Combined with reversal signals such as candlestick patterns or divergence, this can be an entry point in the opposite direction of the current trend.
How to execute the transaction:
Entry: Traders should wait for the price to approach the Imbalance zone before entering a trade. In this area, observe for reversal confirmation signals such as pin bar candlestick patterns, engulfing patterns, or signs of weakening momentum to increase the probability of a trade.
Stop Loss: The stop loss level should be placed outside the boundaries of market imbalance zones to avoid disruptive fluctuations. Setting a reasonable stop loss helps limit risk if the market continues to move against expectations.
Take Profit: The profit-taking target can be determined at the nearest support or resistance levels. Additionally, traders can adjust the take-profit point based on market structure or the desired risk-reward ratio.
Liquidity grab trading strategy
The Liquidity Grab trading strategy relies on identifying Imbalance zones located near areas of concentrated liquidity. Traders monitor price swings through key levels to trigger stop-loss orders. When the price fails to maintain its breakout momentum and returns to the Imbalance zone, this often signals a significant shift in price structure and a high probability of a reversal.
How to execute the transaction:
Entry: Wait for the price to complete the liquidity gathering process, then return to the market imbalance zones and a clear reversal confirmation signal appears on the chart.
Stop Loss: Place a stop-loss order outside the recently cleared liquidity area to limit risk as price continues to fluctuate.
Take Profit: Take profit in the direction of the market’s new movement or at the nearest important support/resistance levels.
Common mistakes to avoid when applying market imbalance zones
When applying market imbalance zones in trading, many traders often make common mistakes that reduce the effectiveness of their strategies. Correctly identifying and avoiding these errors will help increase the probability of successful trades.
Common mistakes to avoid when applying market imbalance zones
Combine additional technical tools and indicators: Market imbalance zones are more effective when confirmed by other analytical tools. Traders should combine volume to assess money flow strength, RSI or MACD to identify overbought or oversold conditions, and observe key support and resistance zones. Using multiple confirming factors reduces noise and increases the reliability of entry decisions, rather than relying solely on a single imbalance zone.
Identify and follow the overall market trend: Trading with imbalance zones has a higher probability of success when aligned with the main trend. Before entering a trade, traders should analyze larger timeframes to determine whether the market is in an uptrend, downtrend, or sideways trend. When trading with the trend, imbalance zones often act as continuation points, allowing traders to enter the market with lower risk compared to trading against the trend.
Strictly adhere to risk management principles: Risk management is essential when trading in market imbalance zones. Traders need to clearly define the risk level for each trade, always place stop-loss orders at reasonable positions, and avoid risking too much capital on a single trade. Adhering to a suitable risk/reward ratio helps protect accounts from unexpected fluctuations and maintain long-term stability in trading.
Patiently wait for a clear confirmation signal: Not every Imbalance zone that appears on the chart is worth trading. Traders need to patiently wait for clear confirmation signals such as reversal candlestick patterns, changes in price structure, or signals from technical indicators. Entering trades too early or trading without confirmation can lead to unnecessary losses, especially during periods of high market volatility.
Conclude
Identifying and applying market imbalance zones helps traders approach the market from a more logical and realistic perspective. These imbalance zones not only reflect the participation of large capital flows but also open up many high-probability trading opportunities. According to PF Insight, to succeed, traders need to combine confirmation signals and adhere to trading discipline instead of relying solely on imbalances.