
Mean Reversion trading focuses on exploiting temporary market imbalances when prices move away from the average. This method is not suitable for emotional trading but requires discipline, patience, and the ability to assess the overall context. Combining technical indicators with strict capital management principles helps increase the probability of success. In this article, PF Insight…
Category Archives: Technical Analysis

17
Dec
Dec
VWAP trading strategy, or volume-weighted average price, is a measure of the average price traded throughout the day based on both price and trading volume. This indicator helps traders understand where the current price stands relative to the market’s average level. VWAP is especially useful in intraday trading, where timing and execution efficiency are critical….
17
Dec
Dec
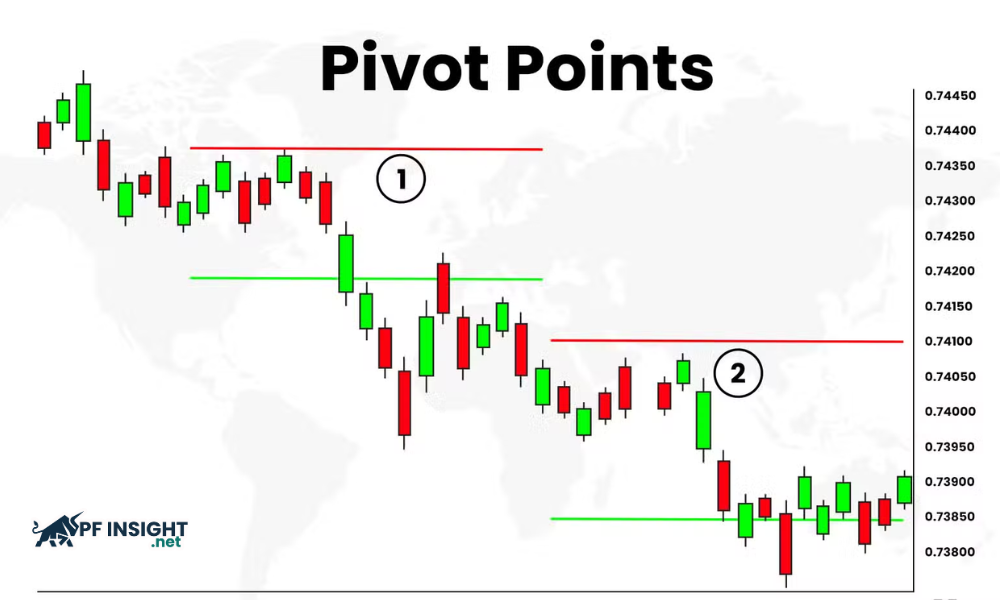
Pivot Points Trading is not simply a calculation tool, but also a method that helps traders logically understand market structure. Based on price data from the previous session, this method helps traders optimize entry points and manage risk more effectively in highly liquid markets. What is the ATR Indicator and how it works in trading…
16
Dec
Dec
The ATR indicator, short for Average True Range, is a technical indicator designed to measure market volatility rather than predict price direction. For beginners, understanding this distinction is critical. Many new traders focus on whether price will move up or down, while overlooking a more important question: how much the market is likely to move….
16
Dec
Dec
Parabolic SAR is considered a useful tool for identifying entry and exit points and managing trends. This indicator is particularly effective when the market has a clear trend, helping traders closely follow the upward or downward momentum of prices. Understanding how Parabolic SAR works correctly will help traders reduce signal noise and improve trading performance….
15
Dec
Dec
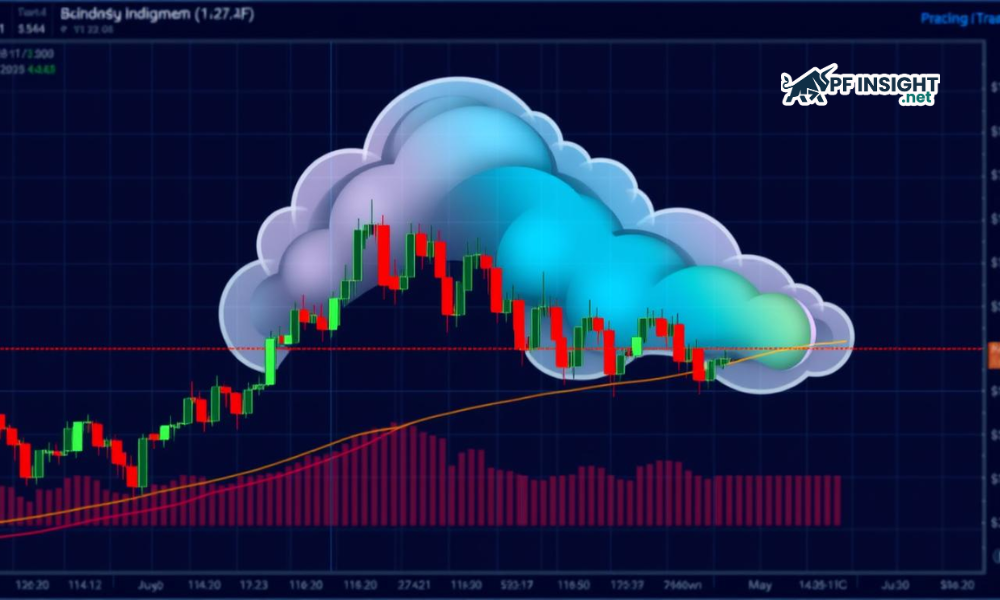
The Ichimoku cloud is considered one of the most comprehensive technical analysis tools, allowing traders to observe trends, momentum, and key price zones on a single chart. With its clear and easily recognizable structure, the Ichimoku cloud helps identify the dominant trend as well as potential entry points. In this article, PF Insight will help…
15
Dec
Dec
The Relative Strength Index, commonly referred to as the RSI indicator, is one of the most widely used momentum tools in technical analysis. Thanks to its simple structure and clear scale ranging from 0 to 100, RSI is especially appealing to new traders. However, this simplicity often leads beginners to misunderstand how RSI actually works….
12
Dec
Dec
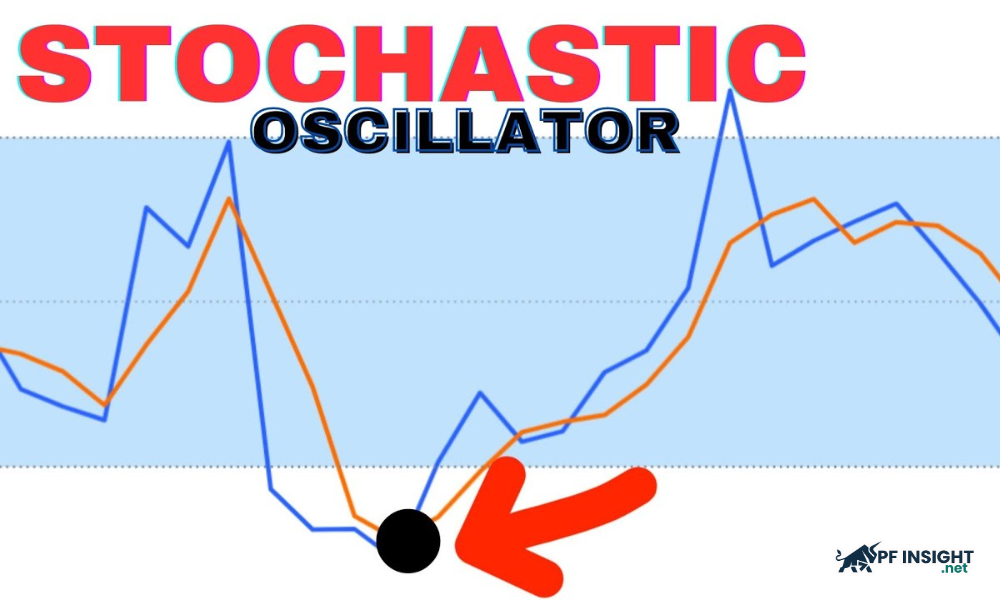
In technical analysis, early detection of reversal signals helps optimize profits. The stochastic oscillator is one of the most important indicators, helping to identify overbought or oversold conditions in the market. This allows traders to make smarter trading decisions, minimize risks, and improve investment efficiency. MACD indicator tips to get better long term results Liquidity…
12
Dec
Dec
Fibonacci retracement is one of the most widely used technical tools for identifying price zones where the market may pause, bounce, or continue following the prevailing trend. Originating from a mathematical concept, Fibonacci retracement has become popular in trading because of its ability to reflect market behavior through key price levels during a pullback. In…
11
Dec
Dec
The MACD indicator is one of the most powerful technical analysis tools, widely used by traders to identify trends and reversal signals. Thanks to its ability to combine moving averages and momentum, MACD helps traders identify entry and exit points more accurately. Understanding how MACD works is crucial for improving trading performance. Liquidity grab strategy:…