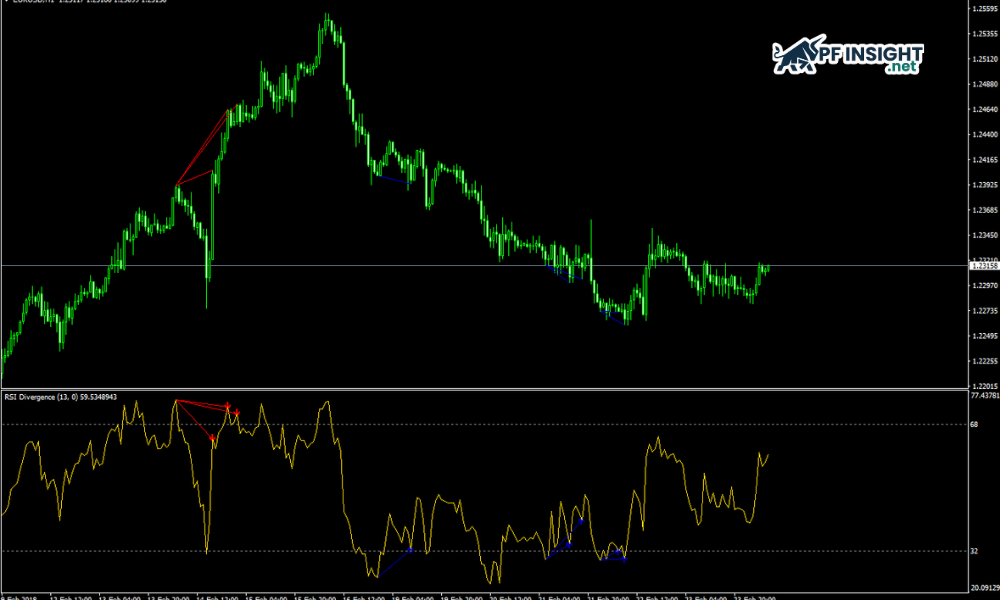
In technical analysis, the RSI divergence is a powerful tool that helps traders detect early signals of price reversals. When the RSI indicator does not align with the price trend, it signals a potential change in market momentum, helping traders make more accurate entry decisions and reduce the risk of losses. MACD histogram: How it…
Category Archives: Technical Analysis

13
Jan
Jan
Many traders start with MACD because it is easy and familiar, but the longer they trade, the more they realize one issue: signals often come late, after price has already moved a significant distance. Meanwhile, the MACD histogram can reveal market momentum shifts earlier, acting like an “early warning system” before an actual crossover appears….

09
Jan
Jan
Support and resistance are foundational concepts that help traders understand how price reacts at key areas on a chart. Learning how price pauses, bounces, or stalls at these zones is the first step toward reading charts in a systematic way. This article focuses on clarifying the most basic concepts, making it suitable for traders who…

08
Jan
Jan
In financial trading, markets don’t move randomly but always follow recurring patterns over time. Understanding market cycles in trading helps traders identify whether the market is in an accumulation, growth, distribution, or recession phase. By grasping market cycles, traders can choose appropriate strategies, avoid emotional trading, and improve long-term investment efficiency. Market structure trading: How…

08
Jan
Jan
In technical analysis, the trendline breakout strategy is often considered one of the common approaches for identifying trend-based entry points. However, using breakouts in a mechanical way, without proper context or clear confirmation rules, has led many traders to experience false breakouts and inconsistent trading results. Together with PF Insight, this article focuses on clarifying…
07
Jan
Jan
Not all trading strategies depend on upward or downward trends. In fact, only traders who truly understand volatility can turn risk into advantage. Volatility trading concepts focus on measuring, analyzing, and trading based on the intensity of price fluctuations, thereby helping traders build strategies that adapt to all market conditions. Market structure trading: How traders…

25
Dec
Dec
Many traders struggle to identify trends and market direction not because they lack tools, but because they do not fully understand how price is formed and how it moves. Market structure trading provides an analytical framework that helps traders clearly see the relationship between swing highs, swing lows, and break of structure points, allowing them…
25
Dec
Dec
Fair value gap trading is a strategy favored by many modern traders to identify unfilled price gaps in the market. By analyzing these price zones, investors can optimize entry points, reduce risk, and increase the probability of successful trades in highly volatile environments. In this article, PF Insight guides you on how to analyze and…
24
Dec
Dec
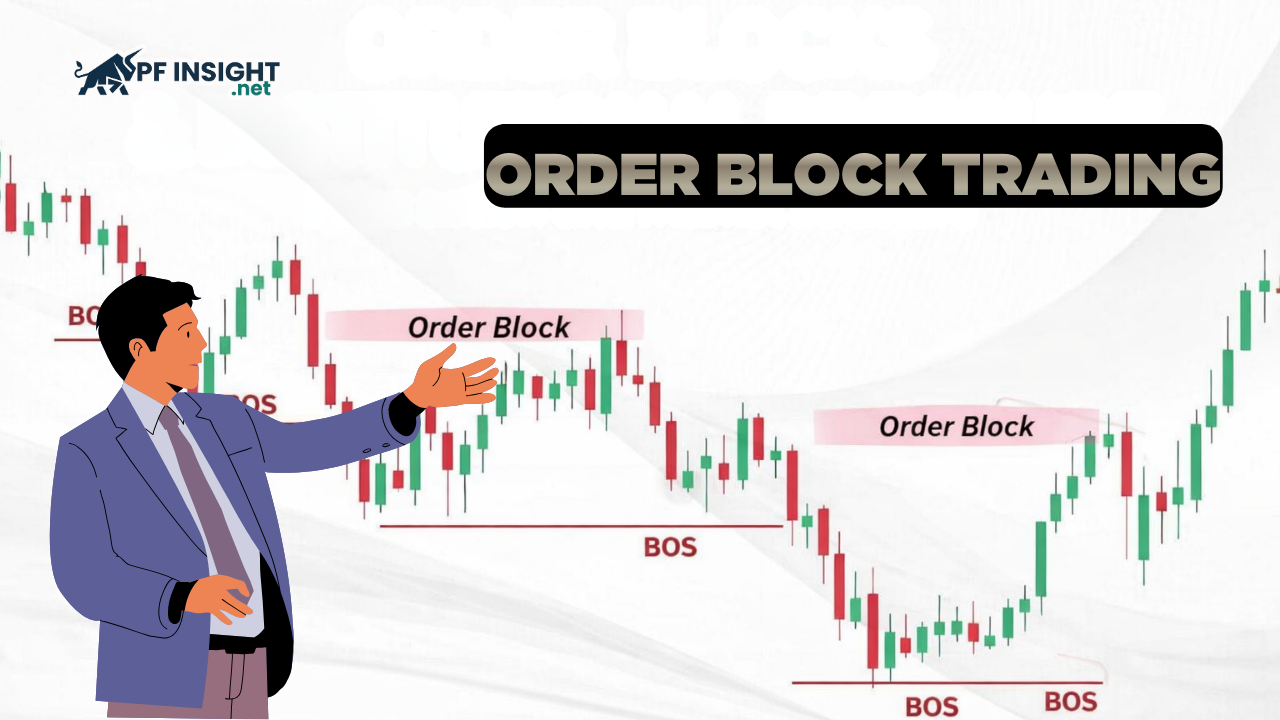
In technical analysis, order block trading is often viewed as a tool for identifying price zones where large institutions are active. However, order blocks should not be understood as standalone trading signals but rather as the result of buying and selling pressure formed during the execution of large-scale orders. In today’s article, Pfinsight.net analyzes how…
24
Dec
Dec
Smart Money Concepts is an analytical method focused on the trading behavior of large financial institutions – the “players” capable of leading market trends. Instead of following traditional indicators, Smart Money Concepts helps traders understand how large sums of money create liquidity, manipulate prices, and identify high-probability entry zones. This is a crucial mindset for…