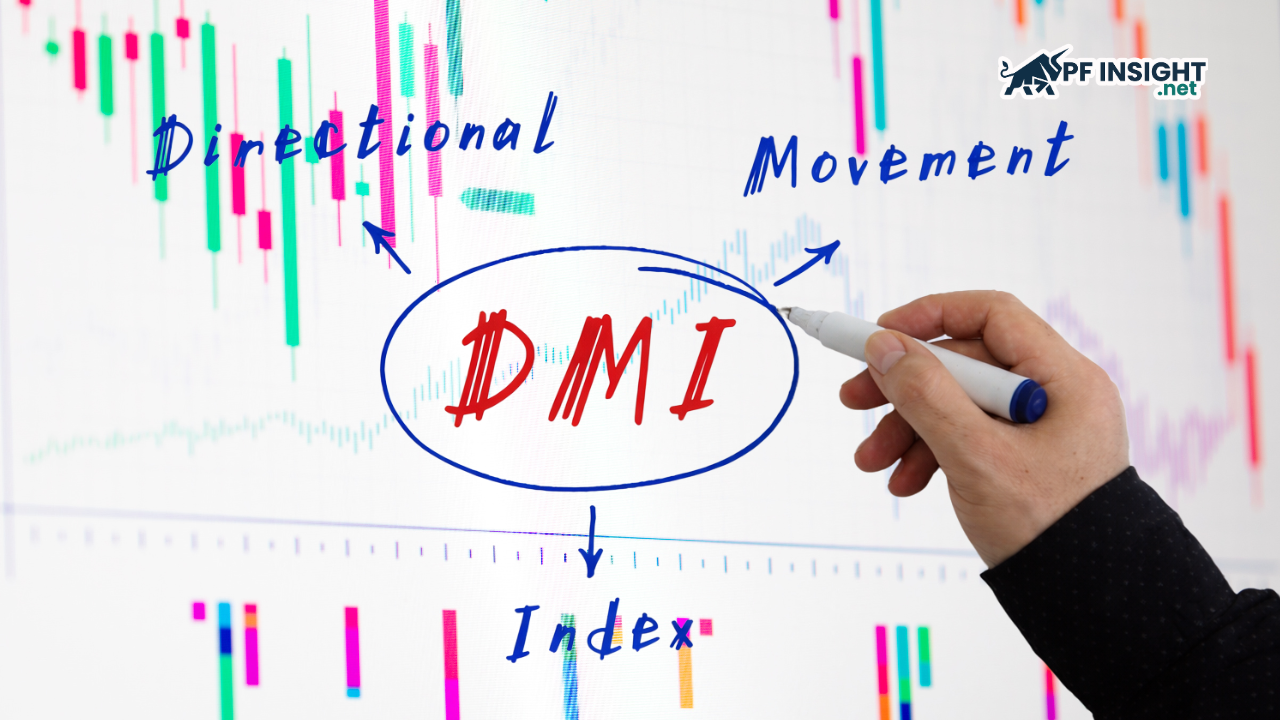
When observing the market, what confuses traders most is not whether price is going up or down, but whether that trend is truly reliable or just temporary noise. Many traders enter based on gut feeling or a few strong candles, only to get “reversed” shortly after because they are trading against real directional pressure. This…
Category Archives: Technical Analysis

21
Jan
Jan
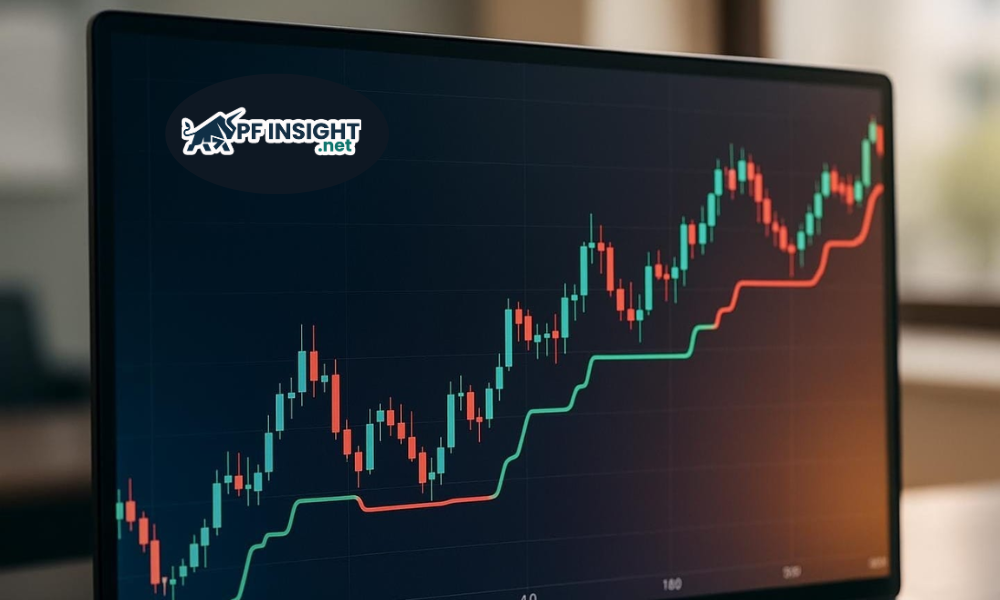
The ADX indicator (Average Directional Index) is an important tool that helps traders measure the strength of a trend rather than simply identifying price direction. In a constantly fluctuating market, understanding whether a trend is strong or weak allows traders to avoid emotional entries. The ADX indicator is especially useful for filtering market noise, reducing…

20
Jan
Jan
Trend strength indicators play a crucial role in helping traders assess whether a trend is strong enough to trade. The market needs to know not only whether it’s rising or falling, but also how sustainable that trend is. By using trend strength indicators, traders can filter out sideways phases, optimize entry points, and improve the…
19
Jan
Jan
Moving average crossovers are an important tool that helps traders confirm trends instead of guessing tops and bottoms. When the short-term moving average crosses above or below the long-term moving average, a clear and credible trading signal emerges. In this article, PF Insight will analyze the advantages, disadvantages, and how to optimize moving average crossovers…

16
Jan
Jan
Average true range volatility (ATR) is one of the simplest yet most useful indicators, helping traders clearly understand market volatility before placing a trade. In fact, many stop-loss hits happen not because you misread the trend, but because your stop was “too tight” relative to volatility at that time. In this article, Pfinsight.net will walk…

16
Jan
Jan
Many traders incur losses not because they lack a strategy, but because they ignore trend & confirmation when entering trades. Markets tend to move in trends, and only when those trends are clearly confirmed do trading opportunities become truly high quality. Understanding and applying trend & confirmation correctly helps traders trade more systematically, maintain discipline,…
15
Jan
Jan
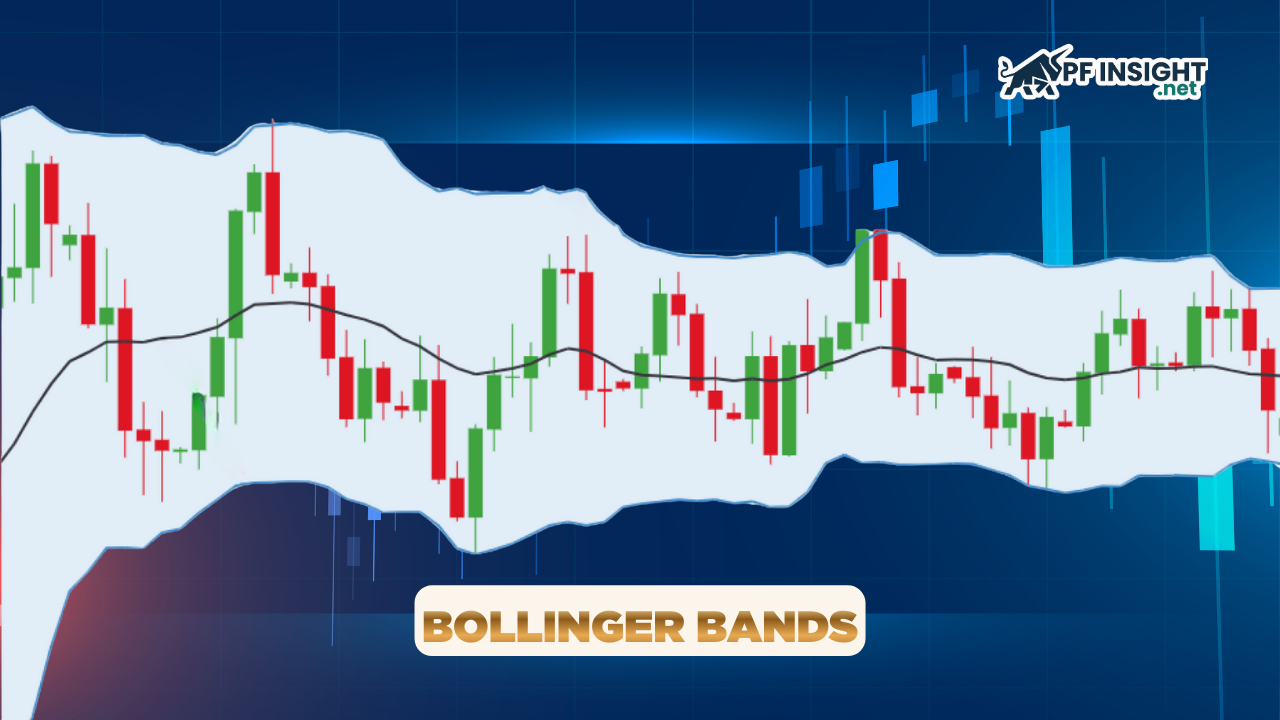
Many traders have experienced the feeling of entering a trade the moment they spot a “breakout incoming” signal, only for price to reverse, throwing off the timing and eliminating the edge. With a bollinger bands squeeze, the issue is not the tool itself, but how we read the signal and act too quickly. That is…
15
Jan
Jan
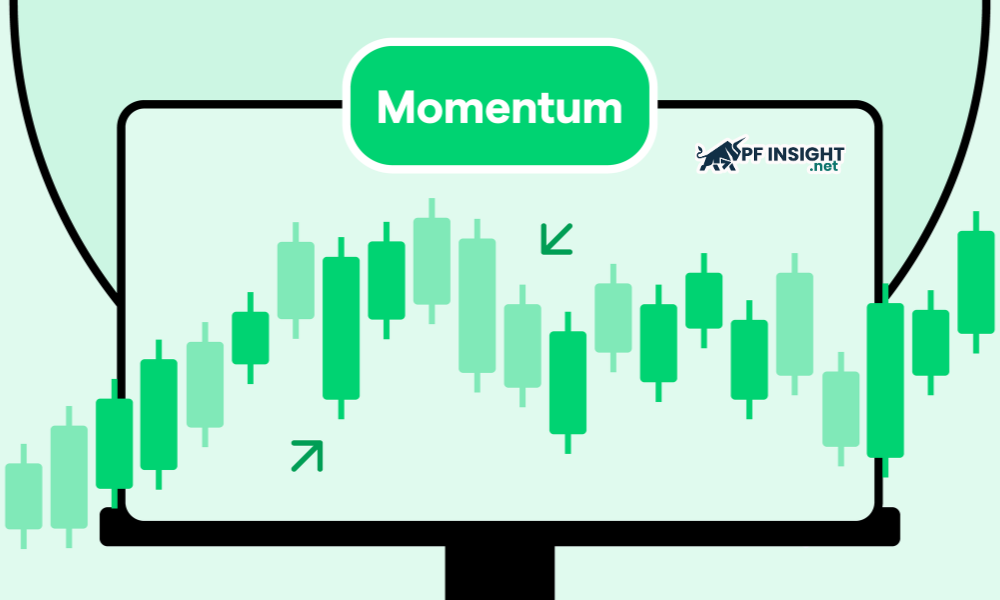
Momentum indicator trading is an indispensable tool for traders who want to gain a deeper understanding of price behavior in financial markets. By measuring the rate of price change, the Momentum indicator helps detect early signals of overbought, oversold, or weakening of the current trend. Applying the momentum indicator correctly will help traders make more…
14
Jan
Jan
Stochastic RSI is an indicator widely used by traders to identify when the market may be overbought or oversold. Compared to traditional RSI, this indicator tends to react faster and generate signals more frequently, helping traders spot momentum shifts earlier. However, because of its high sensitivity, it can also fluctuate sharply and produce noisy signals…

14
Jan
Jan
For traders, understanding market conditions is essential when building a sustainable trading strategy. Overbought and oversold levels reflect the degree of market euphoria or panic, providing crucial clues about the likelihood of a trend reversal or continuation. Properly applying these levels helps traders improve timing and manage risk more effectively. What are overbought and oversold…