
In finance, the efficient market theory posits that prices always accurately reflect value. However, reality is quite different. Price inefficiency in trading refers to moments of imbalance between supply and demand, creating liquidity gaps on the chart. Understanding the nature of this phenomenon not only helps you understand the behavior of large financial institutions but…
Category Archives: Technical Analysis
28
Jan
Jan
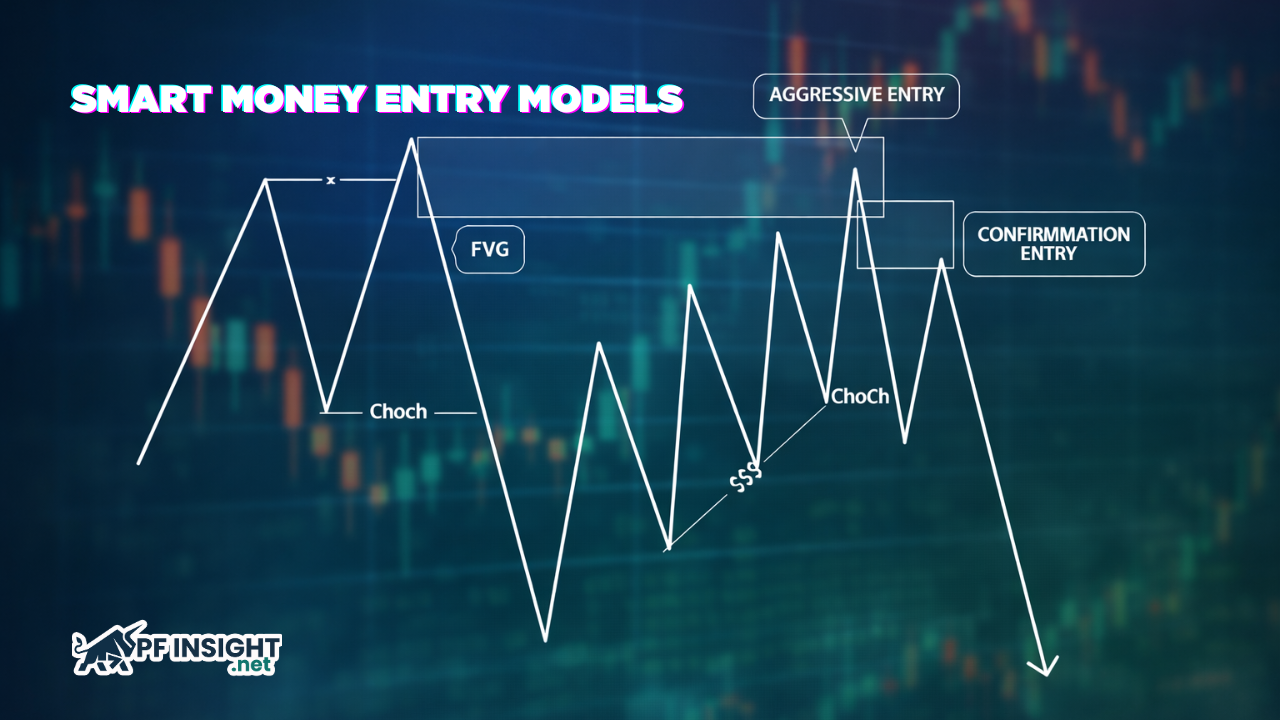
In modern financial markets, timing entries is just as important as predicting trend direction. Smart money entry models are built around how institutions such as banks and hedge funds actually execute trades, rather than relying on common retail technical signals. These models focus on market structure, liquidity, and institutional order flow to identify high-probability entry…

27
Jan
Jan
In financial markets, price does not move randomly but directly reflects the imbalance between buying and selling pressure at each moment. When supply fails to keep up with demand, or vice versa, the market often produces strong moves and opens up high-probability trading opportunities. Correctly identifying supply demand imbalance zones on the chart allows traders…

27
Jan
Jan
In financial trading, market imbalance zones are a crucial concept that helps traders identify price areas where a trend is likely to reverse or continue. These are areas where the market is imbalanced between supply and demand, often appearing after periods of significant volatility. Understanding and correctly applying market imbalance zones will help traders find…
26
Jan
Jan
The market does not move randomly, as many traders believe, but is driven by massive capital flows from large financial institutions. When you understand institutional order flow, you no longer just see price going up or down but begin to read the intention behind each movement. This is how smart money builds liquidity, creates trends,…

26
Jan
Jan
Stop hunting trading is a concept frequently mentioned when traders feel the market “sweeps their stop loss” and then quickly reverses. In reality, this is not random behavior but reflects how large amounts of money seek liquidity at key price levels. Understanding stop hunting trading helps traders avoid impulsive entry and better utilize liquidity sweeps…

23
Jan
Jan
The liquidity pool concept is a fundamental pillar in DeFi, enabling DEXs to swap tokens continuously without relying on a traditional order book. In trading, many traders also observe that price often gets “pulled” toward liquidity levels, where large clusters of pending orders and stop-losses are concentrated. Although these belong to different contexts, both revolve…

23
Jan
Jan
Liquidity sweep trading is not a mechanical entry strategy, but a way to read market intent through liquidity. When price quickly breaks above a recent high or below a recent low and then sharply reverses, it often signals a liquidity sweep. Understanding this behavior helps traders avoid FOMO, improve entry timing, and trade in alignment…
22
Jan
Jan
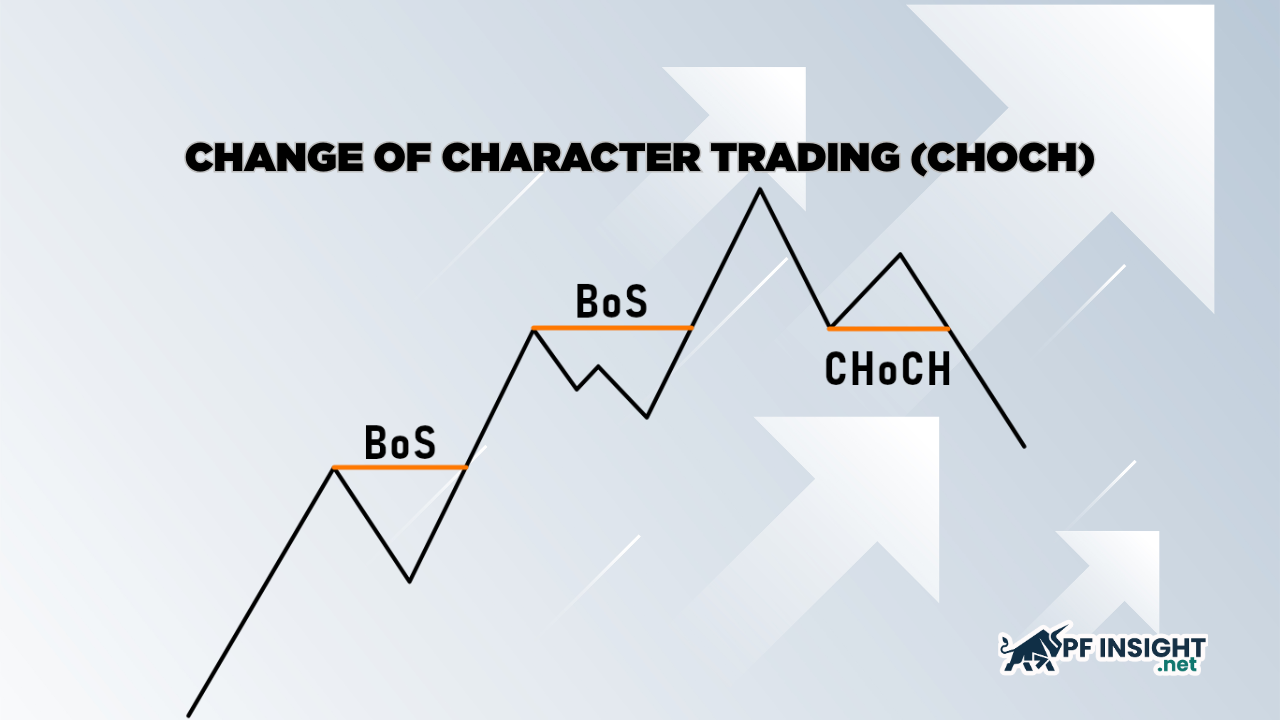
Change of character trading (CHOCH) is one of the most important concepts in market structure, helping traders recognize when the market starts to “change character” and may be preparing for a reversal. However, many traders still confuse CHOCH with Break of Structure (BOS) because both involve price breaking key structural levels. In this article, Pfinsight.net…

22
Jan
Jan
Many traders incur losses by trying to catch tops and bottoms while ignoring signs that the market structure has already changed. Break of structure trading addresses this issue by waiting for clear confirmation from price action before entering a trade. When the structure is broken, it often signals that either buyers or sellers have taken…