Proprietary trading firms are rapidly developing, and they are now considered one of the most effective investment methods that bring high profitability for traders with limited personal capital. However, to trade successfully, Prop Firm projects must be equipped with advanced trading platforms such as MT4, MT5, and cTrader. Among these, the cTrader platform stands out…
Category Archives: Technical Analysis
04
Feb
Feb
As you may know, a trading platform is one of the most important factors that determines success in investing. With their unique combination of tools, features, and benefits, MT4 vs MT5 are widely regarded by traders as the two most popular and widely used platforms. However, for Prop Firm traders – who must adhere to…
04
Feb
Feb
The momentum trading strategy focuses on capturing price movements that show strong continuation in a specific direction. In modern financial markets, momentum has become even more powerful due to increased volatility, algorithmic trading, and rapid news flow. Rather than predicting reversals, momentum traders align themselves with existing market strength and ride trends for short- to…

03
Feb
Feb
Among popular trading styles, the counter trend trading strategy is considered one of the most challenging yet alluring. Entering trades against the main trend can yield high profits if the reversal point is correctly predicted. However, this strategy also carries significant risks due to going against the primary price momentum. In this article, PF Insight…
02
Feb
Feb
In trading, a trend continuation strategy focuses on capitalizing on market momentum by following established trends rather than attempting to predict reversals. In strong trending conditions, price often pauses briefly through consolidation before resuming its original direction. Understanding how this strategy works allows traders to identify higher-probability entries while managing risk more effectively. According to…
02
Feb
Feb
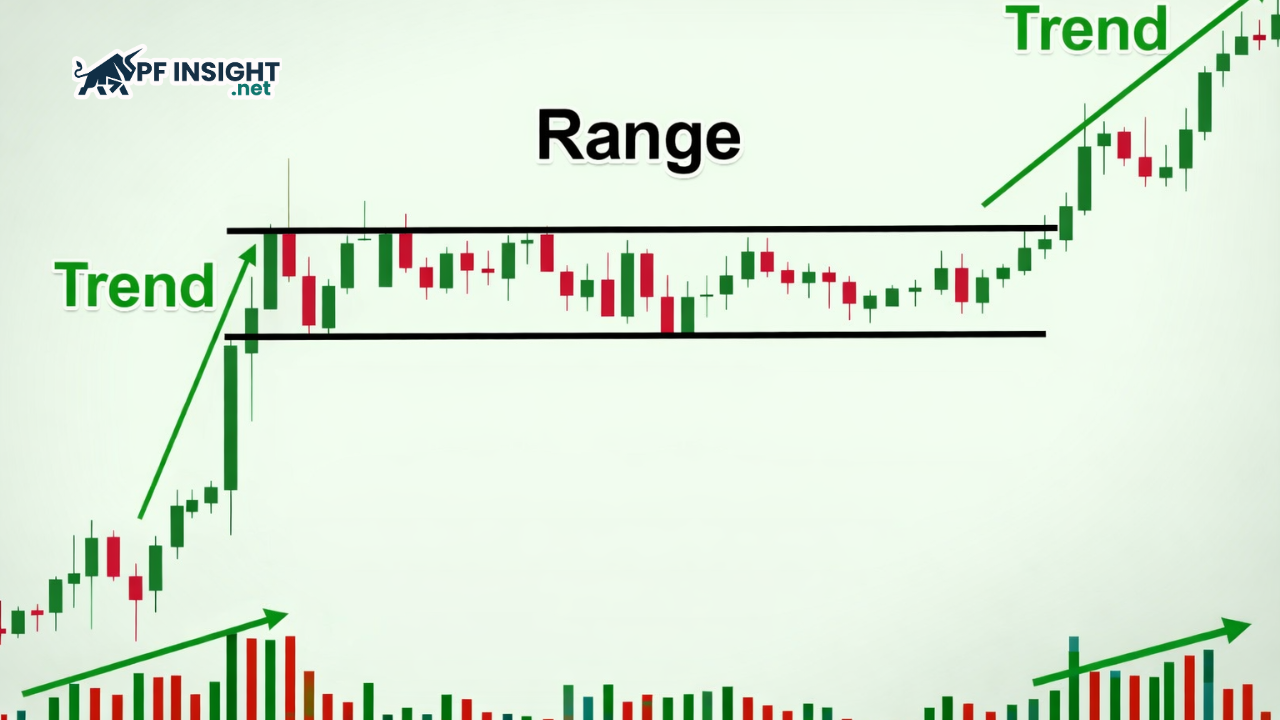
In periods when the market lacks strong directional momentum, the range trading strategy becomes a useful tool for many traders. This strategy is based on the assumption that price tends to oscillate within a defined range, creating opportunities to buy low and sell high. When combined with appropriate confirmation signals, range trading can offer a…
30
Jan
Jan
Many traders correctly identify market trends yet still suffer consistent losses because they enter trades at poor locations within the price structure. In most cases, the problem is not the strategy itself but a lack of understanding of where liquidity forms and how it is exploited. The dealing range in trading helps traders define clear…

30
Jan
Jan
In a constantly volatile market, identifying optimal entry points is more crucial than ever. Premium and discount zones are tools that help traders position their actions within the correct market context, avoiding buying at the top or selling at the bottom. By combining these price zones with market structure, traders can trade more disciplined and…

29
Jan
Jan
Smart money liquidity theory explains how large institutions use order flow and retail traders’ stop-loss clusters to generate powerful price movements in the market. Understanding this mechanism allows traders to read price action more accurately instead of relying solely on technical indicators. This article will break down both the theoretical foundation and the practical ways…

29
Jan
Jan
Prices don’t move randomly. Behind every sharp rise or fall lies a distribution and accumulation strategy by financial institutions. Institutional trading concepts focus on analyzing this behavior through market structure, liquidity, and supply-demand imbalances. By understanding the mindset of these institutions, traders can trade with large money flows instead of against them. How traders analyze…