
In today’s trading market, trading competitions for cash are increasingly attracting the attention of global traders. This is not only a playground to challenge skills, but also an opportunity for traders to improve their reputation, verify strategies and develop their careers. In this article, PF Insight will guide you in detail on how to participate…
Category Archives: Knowledge Hub

10
Nov
Nov
Many newbies often confuse trading and gambling, leading to great risks in investing. While trading is based on analysis and risk management, gambling depends more on luck and emotions. In this article, PF Insight will guide you on how to distinguish and evaluate risks, helping new investors build smart strategies and manage capital effectively. Trading…
10
Nov
Nov
In trading, there’s no shortage of stories about traders who started with just a few hundred dollars and gradually built a sustainable path to success. These trading success stories are not merely about profit figures; they are powerful proof of the strength of discipline, persistence, and emotional control amid market volatility. True success in trading…

07
Nov
Nov
Stop loss strategy not only acts as a risk management tool but also helps traders form discipline in trading. However, placing orders too tight can cause you to miss important opportunities when the market reverses. In this article, PF Insight will guide you on how to set smart stop loss orders and share the secret…
06
Nov
Nov
Quantitative trading strategies use mathematical models, historical data, and automated algorithms to identify buying and selling opportunities in the market. If you are wondering what quant trading is, this article by pfinsight.net will guide in detail how to build and deploy quant trading effectively. Best no evaluation Prop Firm offering direct funded accounts Prop Firm…

05
Nov
Nov
In 2025, the Forex market will be more exciting and challenging than ever. To seize opportunities, traders need to update accurate trading signals in real time. Telegram groups sharing free Forex signals are becoming more and more popular, helping both new and professional traders improve their strategies and maximize profits. In this article, PF Insight…
03
Nov
Nov
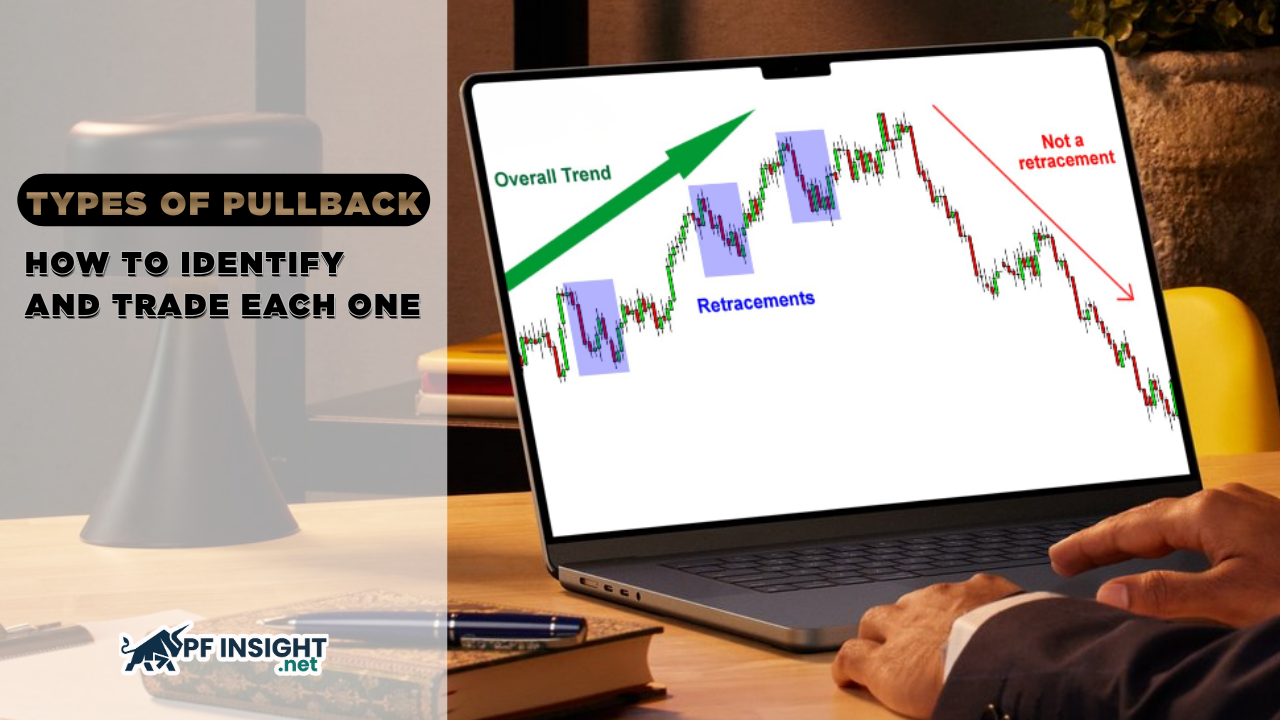
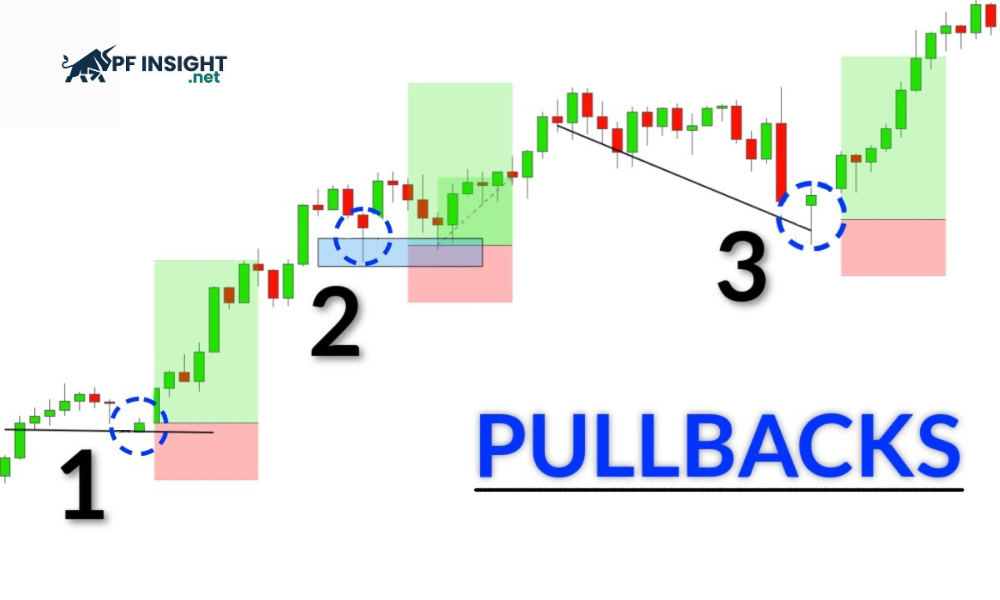
In trend trading, understanding and identifying pullbacks is a key factor that helps traders determine optimal entry points while minimizing risk. A pullback allows traders to join an existing trend during temporary price retracements, rather than chasing breakouts or trying to catch tops and bottoms. Knowing the types of pullback helps traders distinguish between a…

03
Nov
Nov
Momentum indicators are technical tools that help traders assess the strength and speed of price changes, thereby determining the momentum of the current trend. Understanding and applying these indicators correctly helps traders grasp favorable entry points and avoid noise signals. This article will analyze what momentum indicators are, how to use them and trading strategies….
31
Oct
Oct
For traders using MetaTrader 5, technical indicators are an important “weapon” to support analysis and trend identification. However, not everyone knows how to install indicators on MT5 properly. The following article by PF Insight will guide you step by step to install, activate and use indicators to maximize the power of the MT5 platform. What…
30
Oct
Oct
In the financial market, prices never move in a straight line but always fluctuate continuously. This fluctuation creates both opportunities and challenges for traders when finding appropriate entry and exit points. In particular, pullback is a common phenomenon, representing a temporary adjustment in the main trend. So what is a pullback? Let’s pfinsight.net find out…