
Risk management in prop trading is a key factor in maintaining stability and progressing in your trading career. Using the right risk management tools will help protect capital, minimize losses and increase profits, whether you are being sponsored or trying to complete a challenge. Today’s article from PF Insight will bring you practical tips to…
05
Mar
Mar
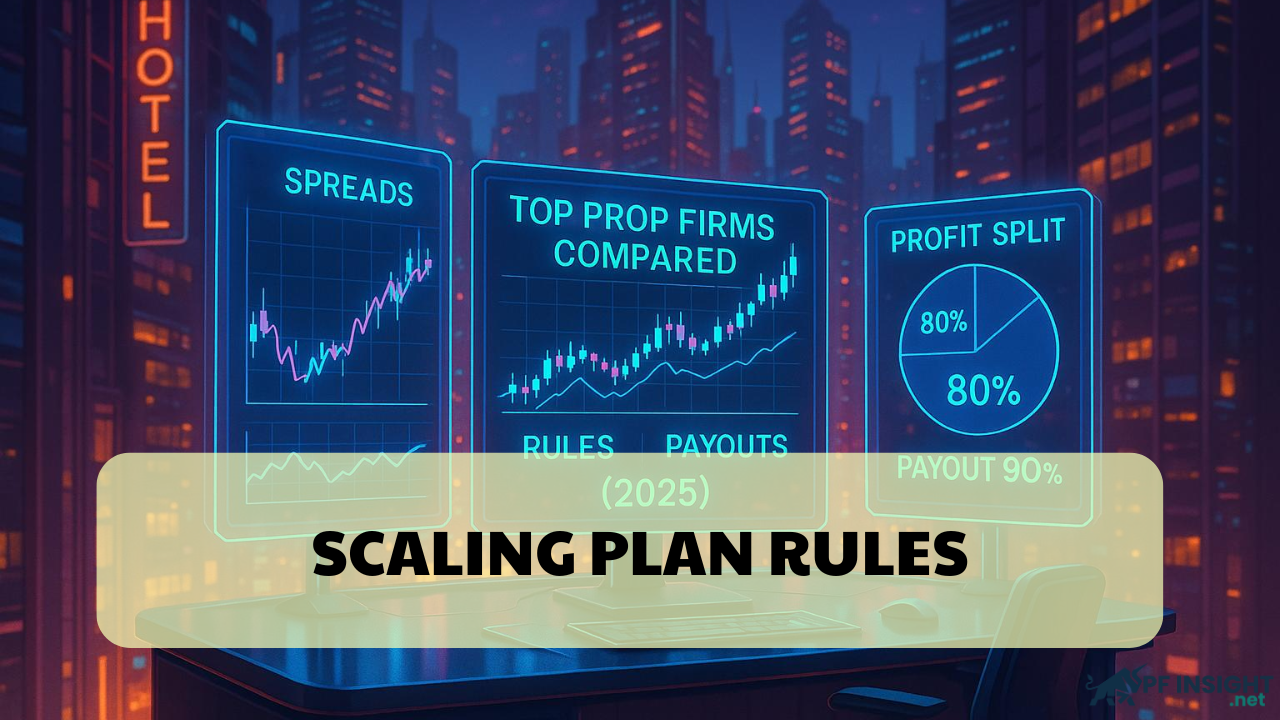
Prop Firm investment is known as one of the most profitable low-capital investment methods that attract traders of all levels. In addition to offering funded accounts with attractive capital, Prop Firms also provide traders with scaling programs with profit-sharing rates of up to 90%. This allows traders to easily increase their profits and earn impressive…
04
Mar
Mar
Although the proprietary trading market is known for being highly profitable, it still comes with strict rules and limitations that every trader must follow to protect capital and minimize risks for Prop Firms. To trade effectively and maximize profits, it is crucial to fully understand the prop trading rules before joining any funded trading program….
03
Mar
Mar
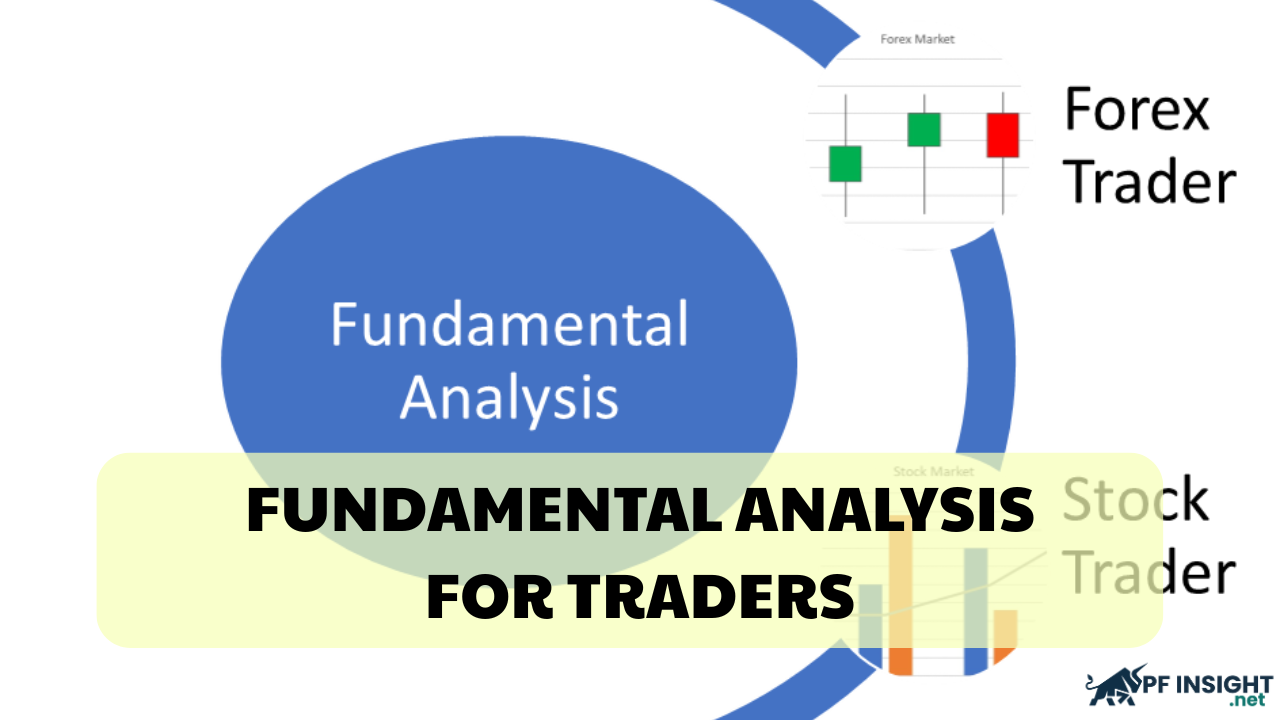
Technical analysis is one of the top factors that many traders pay attention to during the trading process because it provides unique signals and indicators that help traders enter positions more easily. Therefore, traders must have solid knowledge, experience, and understanding of fundamental analysis in the market. But what exactly is fundamental analysis? What does…

03
Mar
Mar
A proper prop firm evaluation process is important for traders who want to access large capital without using their own capital. These tests not only evaluate your trading ability but also your discipline, patience and business mindset. This article by PF Insight will provide in-depth explanations of the process, why many traders fail, and tactics…
02
Mar
Mar
The prop firm market is growing rapidly and has become a fertile ground for traders who are passionate about investing but may not have much capital or time. With this model, a funded trader is allowed to trade and earn profits using the company’s capital instead of their own. However, to receive the funding, traders…
02
Mar
Mar
Financial investment is one of the most attractive forms of investment that many traders favor due to its potential for high returns. However, traders should also note that financial investment involves significant risks that can directly impact profits. This is precisely why traders need to establish principles and prepare carefully to avoid common mistakes in…

27
Feb
Feb
Prop firms have become increasingly popular in recent years due to their ability to provide traders with access to a funded trading account, thereby minimizing personal risk. Using this model, traders can leverage large capital to maximize profits without having to put up too much of their own capital. This article will analyze how prop…
27
Feb
Feb
Financial investment is one of the profitable investment forms chosen by many traders. However, in order to receive funding, traders must pass the firm’s challenges and evaluations. So, how long does a prop firm evaluation take? What factors should traders consider to increase their chances of success during the evaluation process? Let’s explore these questions…
26
Feb
Feb
Trading signals are powerful tools used by many traders to identify market opportunities faster and with greater accuracy. These signals are typically generated using algorithms, technical analysis models, or strategies developed by experienced traders. However, not all market signals are reliable. Many beginners often get drawn into so-called “magic signal groups” or misleading profit promises,…