Fair value gap trading is a strategy favored by many modern traders to identify unfilled price gaps in the market. By analyzing these price zones, investors can optimize entry points, reduce risk, and increase the probability of successful trades in highly volatile environments. In this article, PF Insight guides you on how to analyze and utilize FVG effectively.
- Smart Money Concepts: Understanding how institutional trading moves prices
- What is Mean Reversion trading? An effective Reversion strategy for traders
What is a fair value gap?
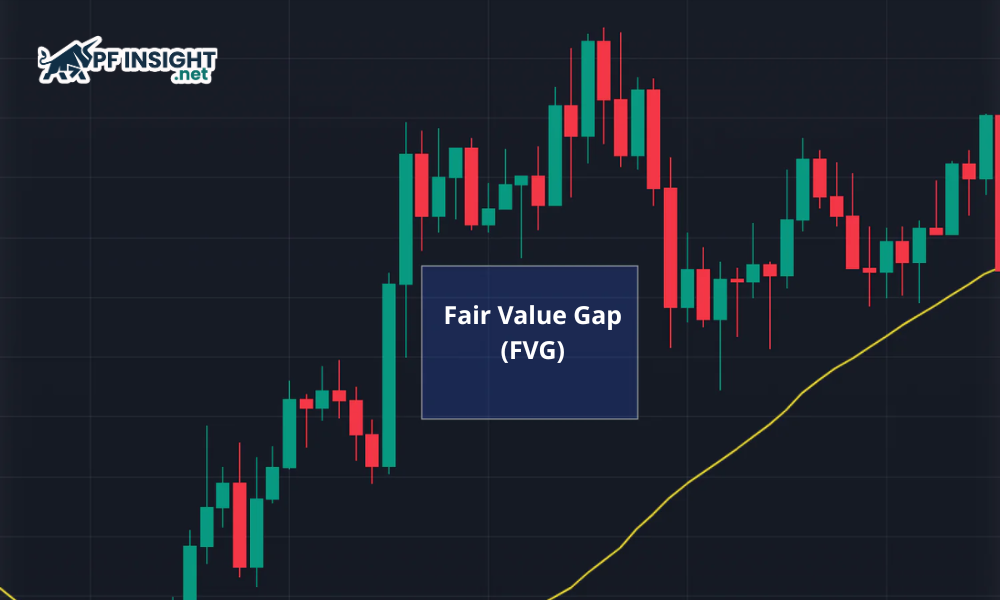
Fair value gap (FVG) indicates imbalance areas on a chart where the price has not been fully traded. In ICT (Inner Circle Trader), this gap reflects strong buying or selling pressure, providing an important signal to predict the next direction of the price.
Simply put, a fair value gap (FVG) is a price gap that appears when one side of the market experiences excessive volatility, leaving the other side unable to react in time. These gaps indicate price levels that have not yet been traded at “fair value,” representing potential opportunities for traders to identify entry points.
See more: How order block trading reflects institutional buying and selling pressure
Fair value gap (FVG) classification in trading
Fair value gap trading can be categorized into different types depending on price direction and market context, supporting effective trading decisions.
Bearish fair value gaps
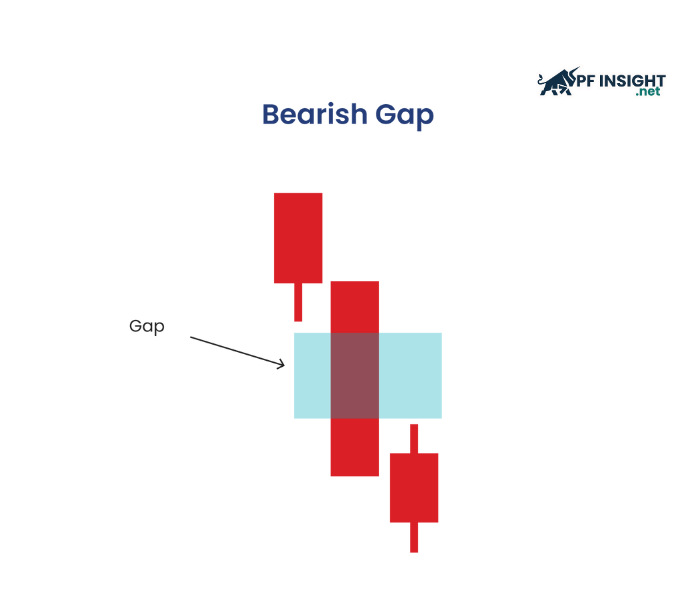
A bearish fair value gap forms when the lowest point of the first candlestick doesn’t connect to the highest point of the third candlestick, often appearing within the middle candlestick body. This reflects an imbalance and the possibility of selling pressure prevailing, helping traders identify effective entry opportunities for short positions.
A decrease in fair value gaps occurs when the market reacts to negative economic news, weak earnings reports, or a sudden shift in sentiment towards pessimism. To identify bearish signals from fair value gap trading, you can consider the following factors:
- Observe three consecutive candlesticks on the chart.
- Identify the lowest wick of the first candle.
- Determine the highest wick of the third candle.
- Check for a gap between the two candle wicks, and if that gap is within the body of the second candle, this could signal a bearish FVG.
- To improve accuracy, confirm the signal with trading volume or other supplementary bearish signals.
Bullish fair value gaps
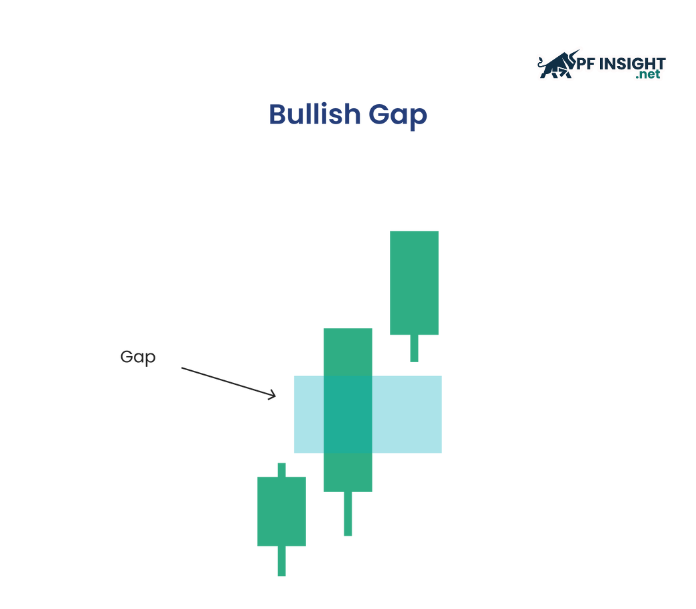
Bullish fair value gaps appear when the highest point of the first candlestick’s wick does not connect with the lowest point of the third candlestick’s wick, creating a gap that reflects strong buying pressure.
Similar to the bearish FVG pattern, the candlestick structure doesn’t focus on the color or closing direction of each candle. The deciding factor is the gap formed in the central candle, where the wicks of the first and last candles don’t intersect. This reflects an imbalance in the upward direction and opens up a potential buying opportunity.
FVG’s price increase is influenced by positive economic news or better-than-expected financial reports, boosting investor optimism. This sudden supply-demand imbalance creates price gaps on the technical chart. To identify bullish signals, observe imbalance zones where buyers completely dominate, signaling a sustained upward trend.
- Observe three consecutive candlesticks on the price chart.
- Identify the highest wick of the first candle.
- Identify the lowest wick of the third candle.
- Check if the two candle wicks overlap; if not, and there is a gap in the middle candle body, this could be a bullish signal for FVG.
- Before placing an order, further confirmation should be sought from increased trading volume or technical indicators signaling a positive outcome.
What causes fair value gaps in trading?
Fair value gap trading occurs when prices fluctuate sharply in a short period, causing an imbalance between supply and demand. This phenomenon often stems from significant news, large-scale trades, or periods of low market liquidity.
- High market volatility: Prices can rise or fall very quickly when the market reacts strongly, leading to the formation of price gaps. This phenomenon often occurs around important news events such as economic data releases, political upheavals, or immediately after the market reopens following a weekend.
- Large-scale transactions from large institutions: Banks and hedge funds often execute orders with very large volumes. When buying or selling simultaneously, the price may skip many levels due to a lack of matching orders. This easily leads to price gaps on the chart. In some cases, large institutions even intentionally push the price up to trigger stop-loss orders from retail traders.
- Breakout from consolidation zone: Price moves within a narrow range for an extended period. Upon breaking out of this zone, a large influx of capital enters the market. The price rises rapidly, overwhelming the market and preventing sufficient trading. As a result, fair value gap trading may occur.
- Low liquidity: When the number of market participants decreases, prices often fluctuate erratically and are less stable. This is common on holidays, weekends, or during late-night trading hours. Due to a lack of matching buy and sell orders, prices may skip many important levels, thus forming FVGs due to price jumps.
- Algorithmic trading: Increasingly, trading orders are executed by computer systems using automated algorithms. These programs react to market fluctuations in just milliseconds, faster than humans. This high processing speed allows prices to move abruptly, creating price gaps before the market has time to adjust.
Guide to identifying fair value gaps on price charts
Fair value gap trading refers to an area on a chart where price moves rapidly, creating an imbalance between supply and demand. In this area, some price fluctuations are not fully reflected in the surrounding candlesticks, indicating that buying or selling pressure temporarily dominates, leaving an unfilled gap.
Step 1: Observe three consecutive candlesticks
Fair value gap trading is identified by recognizing the characteristic structure formed on three consecutive candlesticks.
- Candle 1 – Beginning of a strong movement: Forms a candle with high momentum in a clear direction (up or down). Often appears when there are large trading orders from institutions, pushing the price to move quickly.
- Candle 2 – Trend continuation: The next candle continues to move strongly in the same direction. The price does not return to previous levels, creating a supply-demand imbalance.
- Candle 3 – Confirming the gap: The final candle defines the remaining boundary of the price range. The gap formed between the wick of Candle 1 and the wick of candle 3 is the fair value gap.
This gap is the fair value gap, representing a price range that the market has overlooked due to rapid price movements.
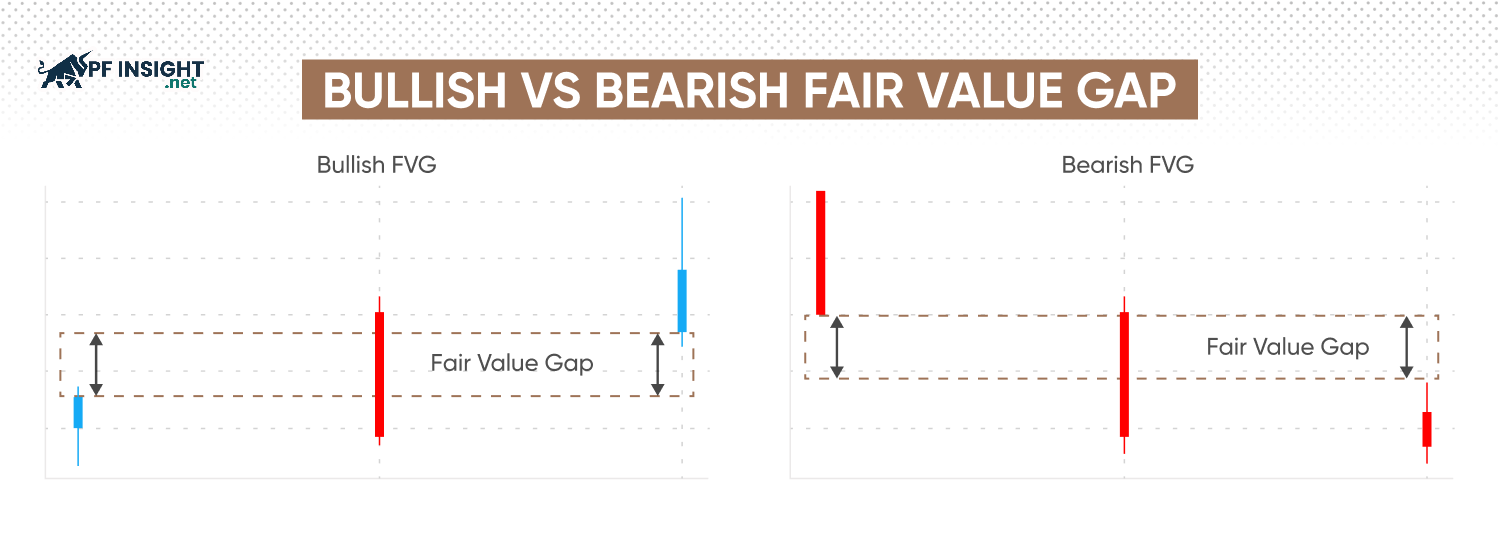
Step 2: Analyze the price range of the candlesticks
When applying fair value gap trading, analyze the price range of each candlestick based on the highest and lowest wicks. Determining whether the middle candlestick is completely covered by the other two will help identify the FVG area more accurately.
- Bullish FVG: A bullish gap is formed when the price of the third candle fails to return to the peak of the first candle. This leaves a portion of the central candle’s range untraded by the market, reflecting dominant buying pressure.
- Bearish FVG: A bearish gap appears when the third candle fails to reach the low of the first candle. This interruption creates a missed price zone within the middle candle, indicating that selling pressure is in control of the market.
Step 3: Highlight the gap on the price chart
In fair value gap trading, traders need to mark the price area of the central candle that is not overlapped by the wicks of the first and last candles. This area is the fair value gap, reflecting the imbalance between supply and demand.
Step 4: Check the validity of the price gap
Confirmation in fair value gap trading plays a crucial role in eliminating weak FVGs, allowing traders to focus on gaps that have the potential to strongly influence price behavior.
- Monitor the price’s reaction when it returns to the gap area, such as slowing down, reversing, or the appearance of rejection candles.
- Assess the change in trading volume as the price approaches the gap area to determine the level of market interest.
- Combine other technical signals such as support and resistance zones to reinforce the reliability of the price gap.
How to use fair value gap trading effectively for traders
Fair value gap trading helps traders identify potential price zones in the market. In the following section, we will analyze FVG trading strategies, how to set entry and exit points, combine technical indicators, and apply risk management to improve trading efficiency.
Trade entry and exit methods
The fair value gap trading strategy is based on the principle that price often retests the FVG (Fair value gap trading zone). At that point, the FVG can become a support zone in an uptrend or a resistance zone in a downtrend, creating clear trading opportunities.
In an uptrend scenario, the market typically breaks out strongly, leaving an untraded area. The price then tends to return to fill this gap before continuing the main uptrend. Traders can wait for the price to retrace to the FVG area to place buy orders, hoping for renewed buying pressure. Conversely, with a downtrend in the FVG market, the price usually rebounds to the gap after a sharp decline, creating opportunities for traders to enter sell orders in line with the trend.
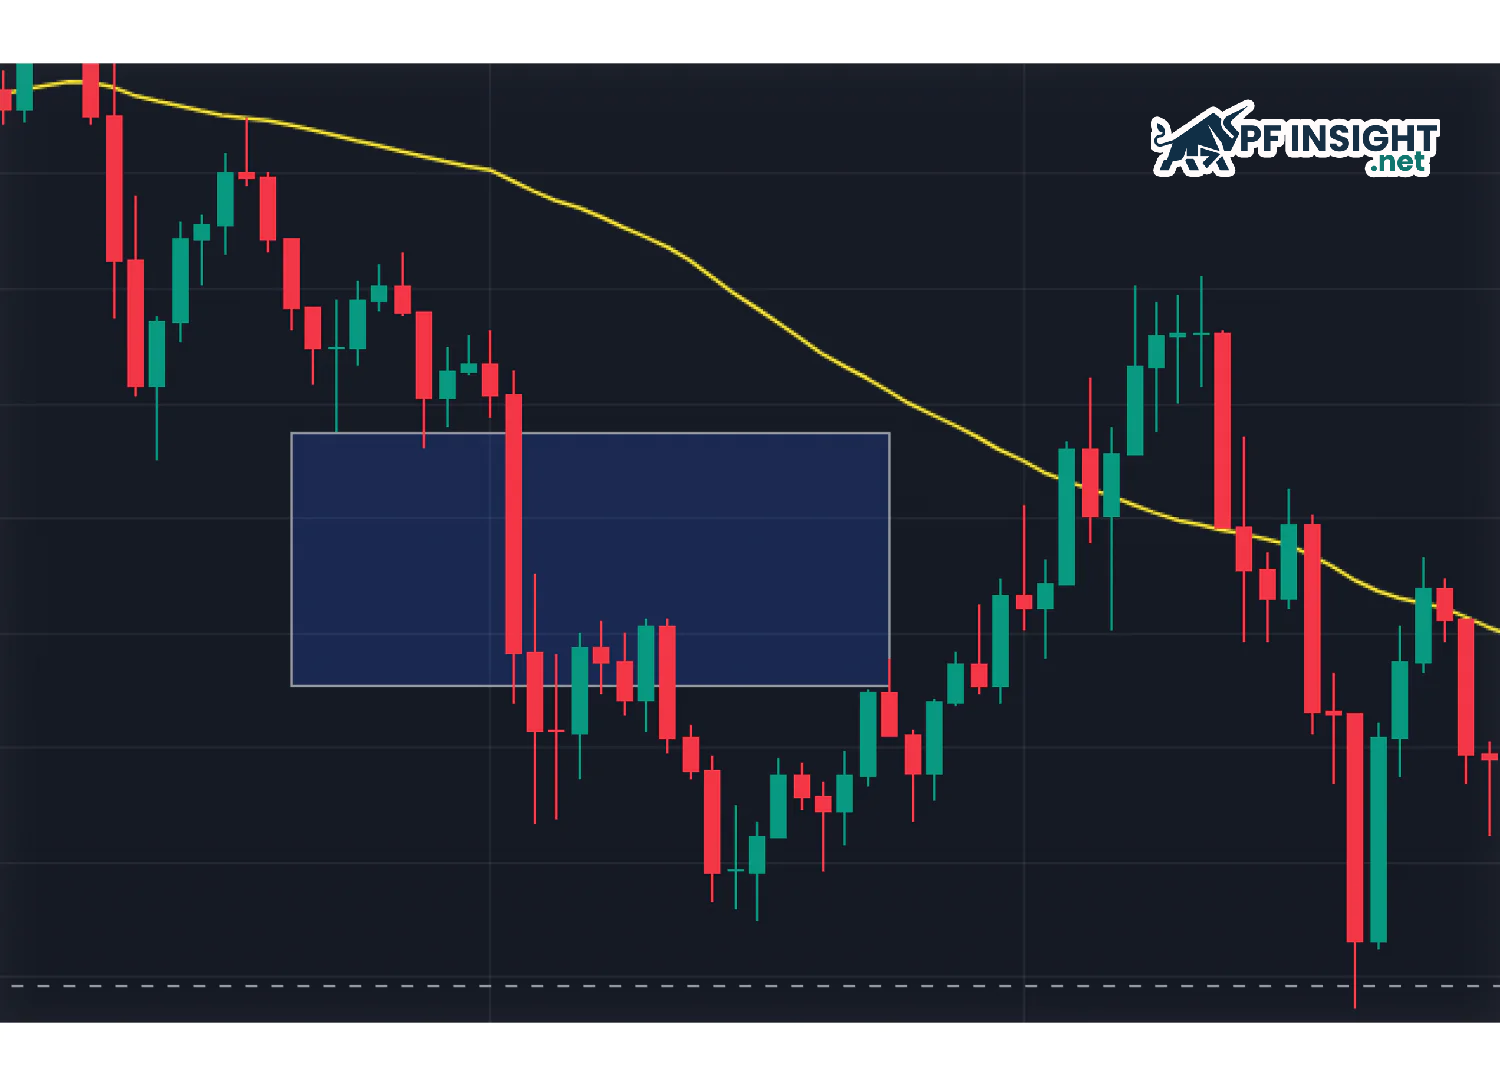
FVG zones identified on the trading chart
Determining the exit point should be based on expected trends and market structure. Some traders choose a safe target in the middle of the gap, while others aim for a higher level to maximize profits. Automatic stop-loss orders help track price movements, both preserving gains and taking advantage of extended upward movements.
Using technical indicators to confirm FVG setups

FVG is most effective when not used alone. When combined with trend, support/resistance, or momentum indicators, it provides traders with additional basis for confirming entry points, thereby minimizing false signals due to short-term volatility.
- Moving Averages: Popular MA lines such as the 50-day Simple Moving Average (SMA 50) or the 200-day Simple Moving Average (SMA 200) are often used to identify the dominant market trend. When a bullish FVG appears against the backdrop of an upward-trending SMA 50, this signal is generally more reliable and increases the probability of a successful trade.
- RSI (Relative Strength Index): When the RSI indicates an oversold market, the formation of a bullish FVG reinforces the likelihood of an upward reversal. Conversely, a bearish FVG appearing in the overbought RSI region often foreshadows downward pressure.
- Fibonacci Retracement: Fibonacci retracement (FVG) zones often coincide with important Fibonacci levels such as 61.8%. When a bullish FVG converges with a Fibonacci level in the main trend, the reliability of the entry point is significantly enhanced.
Capital and risk management principles for FVG trading
In fair value gap trading, no setup guarantees absolute victory. Therefore, risk management plays a crucial role in protecting your account. By applying discipline to trading volume, stop-loss points, and risk-reward ratios, traders can limit losses and maintain a statistical advantage in the long term.
- Setting stop loss orders: Setting a reasonable stop loss is essential to limit risk against unpredictable price fluctuations. When FVG increases, traders typically place the stop loss below the bottom of the FVG range. In the case of a decrease in FVG, the stop loss should be placed above the top of the gap to minimize losses.
- Determine the appropriate entry size: Position size should be adjusted based on total capital and acceptable risk level. The most common rule is 1–2%, meaning each trade should only risk a maximum of 1–2% of the account balance.
- Risk/Reward ratio: Maintaining a reasonable risk/reward ratio is key to optimizing trading results. Typically, this ratio should be 1:2 or higher, meaning that for every dollar of risk, traders expect to earn at least $2 in profit.
Conclude
Fair value gap trading is a powerful tool that helps traders identify under-traded price zones, thereby optimizing entry and exit points. When combined with risk management, technical indicators, and support/resistance levels, FVG can increase the probability of successful trades and help investors effectively manage capital in volatile markets.


