When observing the market, what confuses traders most is not whether price is going up or down, but whether that trend is truly reliable or just temporary noise. Many traders enter based on gut feeling or a few strong candles, only to get “reversed” shortly after because they are trading against real directional pressure. This is why trend tools remain essential in technical analysis. Among them, the Directional Movement Index (DMI) stands out by separating bullish and bearish pressure through the +DI and -DI lines. In this article, FP Insight will explain the role of positive vs. negative directional movement so you can read +DI/-DI correctly and apply DMI more effectively in trading.
- Trend strength indicators and how traders judge whether a trend is reliable
- Moving average crossover and how traders identify trend changes
- Average true range volatility: How traders adjust stop loss placement
What is the directional movement index (DMI)?
The directional movement index (DMI) is a technical analysis indicator designed to help traders identify trend direction and assess whether bullish or bearish pressure is dominating the market. Instead of simply looking at whether price is rising or falling, DMI focuses on a more important question: which side, buyers or sellers, is “driving the market” more strongly? As a result, traders can use DMI to confirm trends, filter out noise, and find trading signals based on shifts in the balance of power between the two sides.
The indicator was developed by J. Welles Wilder Jr. in 1978, around the same time he introduced other well-known tools such as RSI, ATR, and Parabolic SAR. Although it was created decades ago, DMI remains effective in modern trading because it is based on a timeless core principle: a trend is only sustainable when the direction of price movement is clearly supported by underlying market pressure. Whether in stocks, forex, or crypto, the push-and-pull dynamics between buyers and sellers repeat over time, which keeps DMI especially useful during strong trending phases.
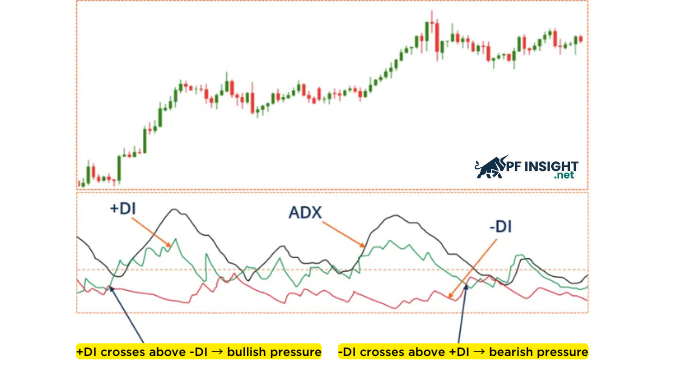
Structurally, DMI consists of three main components:
- +DI (Positive Directional Indicator): represents bullish directional pressure, showing how strongly buyers are in control.
- -DI (Negative Directional Indicator): represents bearish directional pressure, showing how strongly sellers are dominating.
- ADX (Average Directional Index): measures trend strength but does not indicate direction – ADX only tells you whether the trend is strong enough to be worth trading.
In short, if you need a tool that helps you “read direction” while also giving a clear view of buyer-versus-seller dominance, DMI is one of the most valuable indicators to learn and incorporate into your trend analysis system.
Positive vs negative directional movement: the core idea behind +DI and -DI
To understand DMI correctly, you need to grasp one key point: Positive Directional Movement and Negative Directional Movement are not simply “price going up” or “price going down.” This is J. Welles Wilder’s method of measuring directional force based on the behavior of highs and lows across two consecutive sessions, which then forms the +DI and -DI lines.
What is positive directional movement (High/Low logic)?
Positive Directional Movement (+DM) occurs when the market shows clear upward force by making a higher high: Current High > Previous High
However, a higher high alone is not enough for +DM to be counted. Wilder used a “force comparison” logic between upward and downward movement within the same session:
- UpMove = Current High – Previous High
- DownMove = Previous Low – Current Low
Rule for determining +DM:
- If UpMove > DownMove and UpMove > 0 → +DM = UpMove
- Otherwise → +DM = 0
In simple terms: +DM is only recorded when the force pushing to a new high is stronger than the force pulling price down to a lower low. This helps DMI filter out small upward ticks that do not reflect real trend strength.
What is negative directional movement?
Similarly, Negative Directional Movement (-DM) reflects downward force through the formation of a lower low: Current Low < Previous Low
Wilder still applies the same comparison mechanism to avoid double-counting in sessions that show both upward and downward signals.
Rule for determining -DM:
- If DownMove > UpMove and DownMove > 0 → -DM = DownMove
- Otherwise → -DM = 0
You can interpret this as: -DM only appears when the force creating a new low (bearish pressure) outweighs the force creating a new high.
Why directional movement is not the same as simple price up/down
Many new traders mistakenly think:
- If the close is higher → the market is bullish
- If the close is lower → the market is bearish
But DMI’s directional movement is not based on the close. It is based on the expansion of highs and lows, which can reflect real pressure more effectively in many situations.
For example:
- There are sessions where the close is higher, but the high fails to break the previous high while the low is pushed significantly lower. In that case, directional pressure may still lean bearish.
- Conversely, there are sessions where the close is lower, but the high still breaks above the previous high and the downward push is weak. In that case, directional pressure may still lean bullish.
That is why directional movement focuses on this question: “During this session, did the market expand more clearly in one direction?”
This is exactly why DMI remains useful in modern trading: it helps traders see who is truly controlling market direction, rather than being misled by a few candles or short-term volatility.
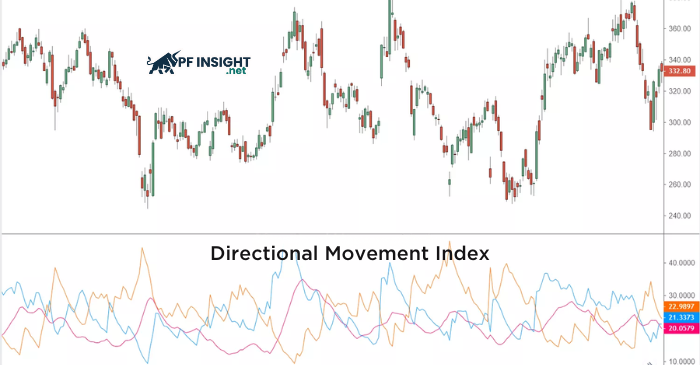
How to read +DI and -DI like a trader
Once you understand what Positive/Negative Directional Movement means, the next step is learning how to read +DI and -DI like a trader. The key point is this: +DI/-DI is not a future-prediction tool, but a gauge that shows which side is applying stronger directional pressure at the current moment. If you read it correctly, you can significantly reduce emotional trading such as “the chart looks green so I buy” or “it’s red so I sell.”
Quick rule: the line on top controls direction
The most basic (and most important) way to read it is:
- +DI > -DI → bullish directional pressure (buyers control direction)
- -DI > +DI → bearish directional pressure (sellers control direction)
This is not an “enter immediately” signal. It is a context signal: it tells you which direction the market is leaning. In live trading, this helps answer the key question: “Am I trading with the market’s directional force, or against it?”
Reading the distance between +DI and -DI: clean trend or noise?
A common mistake is looking only at which line is above the other while ignoring something even more important: the distance between +DI and -DI. You can interpret it very simply:
- Wider distance → clearer directional pressure → the trend has “strength”
- Narrower distance → balanced pressure → the market is more likely to be noisy
If +DI is only slightly above -DI, it often just means buyers are only marginally stronger, not enough to produce a clean trend. But when the distance expands significantly, the market is usually moving in a clear direction and becomes easier to trade.
Three +DI/-DI contexts traders must distinguish
1.Clear, tradable trend
Signs: one line is clearly above the other, the distance stays consistently wide, few crossovers.
Example: +DI holds above -DI with solid separation → the market has a bullish bias and long setups can be prioritized in the trend direction. In this condition, +DI/-DI is most valuable as a trend confirmation tool.
2.Weakening trend or “losing strength”
Signs: the dominant line is still on top but begins declining, the distance starts contracting, the market shows early signs of losing momentum in the main direction
Example: +DI remains above -DI, but it starts falling while -DI moves closer → bullish pressure is weakening.
For experienced traders, this is not a guaranteed reversal signal, but an early warning to:
- Reduce expectations of a long trend continuation
- Tighten trade management
- Be cautious with chase entries
3.Chop/sideways: the false-signal zone
Signs: +DI and -DI weave through each other repeatedly, multiple crossovers in a short time, small distance that shifts quickly
This is the classic DMI “crisscross” state. In chop conditions, +DI/-DI crossovers can produce many signals with little follow-through, causing repeated stop-outs if you trade crossovers mechanically.
That is why the trader-style reading is: When +DI and -DI keep crossing → stay out, switch to a range strategy, or wait for an ADX filter.
Trading signals with DMI: crossovers, confirmation, and timing
Instead of treating DMI as an “entry signal,” professional traders often use DMI as a directional filter: which side the market is leaning toward, buyers or sellers, and whether that bias is clear enough to execute a strategy. Therefore, this section will follow the logic of Signal → Filter → Trigger → Timing, helping you use +DI/-DI in a more systematic way.
Signal: identify “who is leading” with +DI and -DI
DMI produces its most important signal when the balance of force shifts to the other side:
- Bullish condition: +DI > -DI
- Bearish condition: -DI > +DI
Key point: this is a directional signal, helping you decide whether to prioritize long or short setups and filter out trades that go against the dominant directional pressure.
The crossover rule: a shift signal (but not an entry)
A crossover happens when the DI lines cross each other:
- Bullish crossover: +DI crosses above -DI
- Bearish crossover: -DI crosses above +DI
However, a crossover only indicates that directional pressure has shifted. It does not guarantee that the price will move immediately. In practice, crossovers are most unreliable when the market is sideways/choppy and highly volatile with sharp spikes followed by reversals. Therefore, treat the crossover as an early warning of a potential trend shift, not an “entry button.”
Confirmation: use DMI to confirm setups (instead of creating setups)
The most effective way to use DMI is to turn it into a confirmation layer for an existing strategy.
For example:
- If you trade trend-following setups → DMI confirms the trend direction
- If you trade breakouts → DMI confirms the breakout has directional pressure behind it
- If you trade pullbacks → DMI confirms the pullback has not flipped to the opposite side
Simple rule:
- Only look for long setups when +DI is above -DI
- Only look for short setups when -DI is above +DI
This way, DMI helps you significantly reduce trades that are “correct by pattern but wrong by context.”
Timing: 3 common entry approaches when using DMI
DMI does not provide the most precise entry point, but it helps you time entries in alignment with the trend. Below are three common timing approaches:
Breakout timing (for momentum trading)
- +DI > -DI (or a fresh bullish crossover has occurred)
- Price breaks above resistance or a range
- Enter on the breakout or wait for a short pullback
Best suited for fast, momentum-driven trend conditions.
Pullback timing (fits most traders)
- +DI > -DI remains stable
- Price pulls back into support/structure/MA zones
- Enter on a recovery signal (candles or structure)
This is the “safest” timing style because it avoids chasing price.
Reversal timing (only with structure confirmation)
- A crossover occurs and the dominant side flips
- Price breaks structure (break of structure)
- Enter on the retest in the new direction
Note: reversals are more prone to noise, so additional filters are needed (next section: ADX).
A practical rule set: turning DMI into a decision-making process
If you want to simplify how you use DMI, follow this rule set:
- Define directional bias: +DI > -DI (prioritize longs) / -DI > +DI (prioritize shorts)
- Treat crossovers only as context shifts, not instant entries
- Use price-based triggers: breakout / pullback / structure
- Avoid chop conditions: frequent crossovers = high risk of false signals
Conclusion
The Directional Movement Index (DMI) is a tool that helps traders identify trend direction by comparing the strength between +DI and -DI, allowing you to understand whether buyers or sellers are dominating the market. When used correctly as a context-confirmation layer, DMI can help you filter out noise more effectively and make trading decisions more consistently according to your plan. We hope this article helps you understand the core concept of Positive/Negative Directional Movement and apply it effectively in real trading. Wishing you disciplined and successful trading. Do not forget to explore more useful articles in the Technical Analysis section.


