Many traders correctly identify market trends yet still suffer consistent losses because they enter trades at poor locations within the price structure. In most cases, the problem is not the strategy itself but a lack of understanding of where liquidity forms and how it is exploited. The dealing range in trading helps traders define clear high and low boundaries of price, allowing for more precise entries based on how the market truly operates. When combined with premium and discount zones, traders can avoid common price traps and significantly improve win rates over time. This PF Insight article will guide you through how to identify and apply dealing ranges effectively in real market conditions.
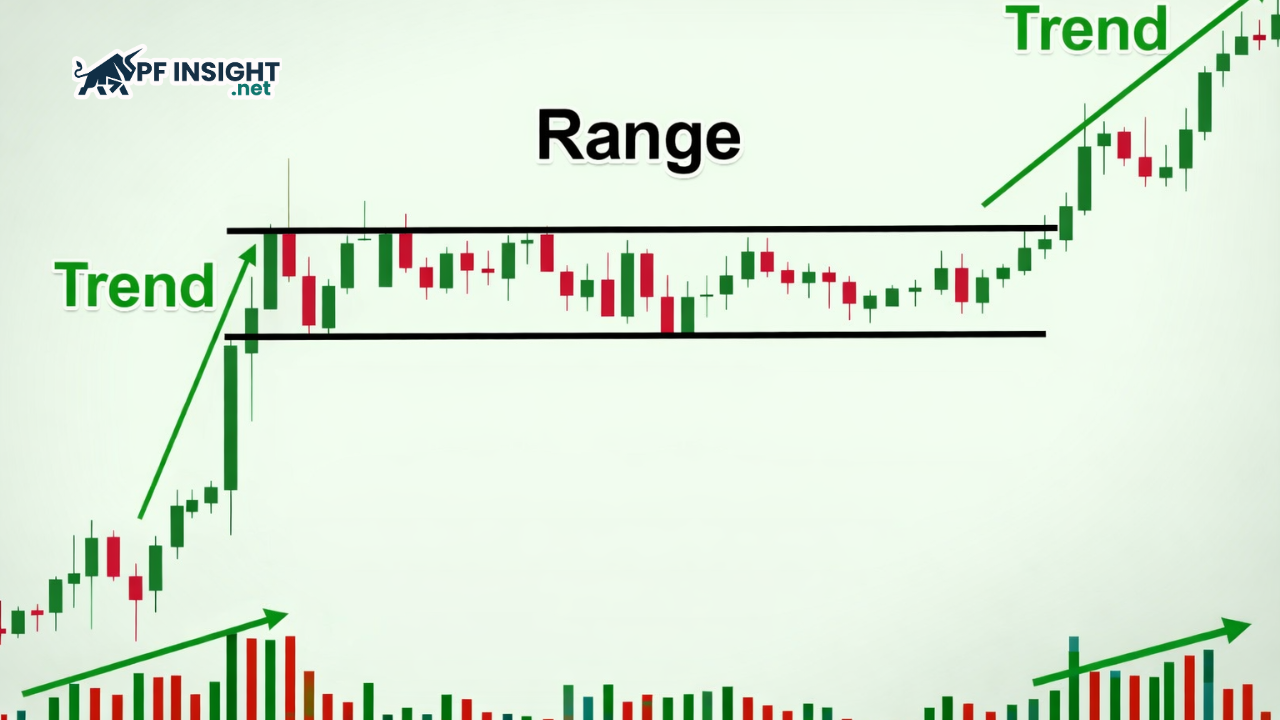
A dealing range is a price framework formed after the market sweeps both a swing high and a swing low, followed by a strong expansion move in one clear direction. This expansion reflects institutional participation and establishes the upper and lower boundaries of the range.
Simply put, the dealing range shows where the market is “re-pricing” after sufficient liquidity has been collected from both buyers and sellers.
The relationship between dealing range, market structure, and liquidity
In market structure trading, price does not move randomly. It frequently breaks key highs and lows to attract stop losses and pending orders from retail traders. Once liquidity on both sides is collected, institutions push price in the true directional move. The dealing range is the result of this process:
The expansion move reveals the real market direction
The price inside the range becomes the institutional execution zone
This is why dealing range is tightly connected to both market structure and liquidity behavior.
Why dealing range improves entry timing
When used correctly, dealing range allows traders to:
Avoid entering trades at overpriced or underpriced levels
Identify high-probability continuation and reversal zones
Naturally improve risk-to-reward ratios
Trade with structure instead of emotional reactions
Rather than chasing breakouts, traders learn to wait for price to return to optimal zones inside the dealing range before entering positions.
How a dealing range forms in market structure
For a dealing range to form, the market usually goes through a liquidity-collection process on both sides before confirming its true direction. This process is not random; it follows a very common structure seen in smart money price action.
What does sweeping swing highs and swing lows mean?
A swing high sweep and swing low sweep occur when price temporarily breaks previous key highs or lows in order to trigger stop losses and pending orders.
Specifically:
When price moves above a swing high, sell stop losses and buy stop orders are triggered
When price moves below a swing low, buy stop losses and sell stop orders are triggered
These sweeps pull in large amounts of liquidity, which institutions need to enter positions at scale.
The expansion move confirms institutional flow
Once liquidity on both sides has been collected, the market typically produces a strong expansion move in one clear direction.
Common characteristics of an expansion move include:
Large candle bodies with minimal wicks
Fast and decisive price movement
Breaks in short-term market structure
This move reflects institutional capital taking control and becomes the foundation for defining the dealing range.
Dealing range formation showing premium and discount zones after expansion move
How to mark the high and low of a dealing range
To identify a dealing range on your chart:
Locate the most recent sweep of both swing high and swing low
Find the strong expansion move that follows
Mark: The lowest price before the expansion was the range low; the highest price of the expansion is the range high
The price area between these two points becomes the dealing range where the market is most likely to react in the next phase.
Premium and discount zones explained
Once the high and low of the dealing range have been identified, the next step is to divide this price range into two equal parts to define the premium zone and the discount zone. This framework allows traders to understand whether price is currently trading at a relatively “expensive” level or a “cheap” level within the market structure.
Dividing the dealing range into two halves
Splitting the dealing range is straightforward:
Identify the range high (the highest price of the dealing range)
Identify the range low (the lowest price of the dealing range)
Calculate the midpoint, known as the equilibrium level
Everything above equilibrium is considered the premium zone, and everything below equilibrium is the discount zone.
This simple framework gives traders an objective pricing reference instead of relying on emotions or subjective judgment.
The meaning of “expensive vs cheap price”
From a smart money perspective:
Price in the premium zone is considered expensive
Price in the discount zone is considered cheap
Institutions generally avoid buying at expensive prices or selling at cheap prices unless their objective is to manipulate liquidity and position for larger moves. As a result, markets often drive price into the discount zone before initiating major bullish expansions and push price into the premium zone before significant bearish moves. This recurring behavior explains why price frequently retraces toward the middle of the dealing range to rebalance before continuing in the dominant market direction.
When to prioritize buys or sells
The core principle of using a dealing range is straightforward.
In a bullish market structure or uptrend, traders should prioritize buy setups in the discount zone.
In a bearish structure or downtrend, traders should focus on sell setups in the premium zone.
Trading from these optimal price areas helps:
Reduce the likelihood of stop-loss sweeps
Improve risk-to-reward ratios
Eliminate emotional, impulsive entries
Instead of reacting to every minor price fluctuation, traders patiently wait for the price to return to high-probability zones where institutional participation is more likely to occur.
Why liquidity drives price inside a dealing range
Price does not move randomly within a dealing range. Most of the back-and-forth movement inside the range serves one primary purpose: attracting and exploiting liquidity. Large institutions require deep liquidity to enter positions with significant size without causing excessive slippage. As a result, they frequently drive price toward areas where retail traders’ stop losses and pending orders are heavily concentrated. This is why price often oscillates within the dealing range before a true directional move begins; the market is effectively gathering the liquidity needed for institutional execution.
How do stop-loss clusters form?
When price reacts multiple times at a key level within the premium or discount zone:
Traders begin entering positions in the same direction
Stop losses are typically placed in similar areas
A “liquidity cluster” is formed
These clusters become ideal targets for the market to sweep before moving in the true directional trend.
Liquidity grabs – the liquidity sweep before expansion
A liquidity grab occurs when price deliberately makes a short-term break of a key level in order to:
Trigger stop losses
Attract breakout orders
Generate sufficient liquidity for large institutions
Once liquidity has been collected, the market often reverses quickly and continues in the direction of the main trend.
False breaks – a common price trap within the dealing range
A false break is a direct consequence of a liquidity grab. Price appears to break out of a range or a key level, prompting many traders to enter trades impulsively. However, shortly afterward, the market reverses sharply and moves back into the discount or premium zone to complete liquidity collection. This is why many “technically correct” setups still fail if the position within the dealing range is not taken into account.
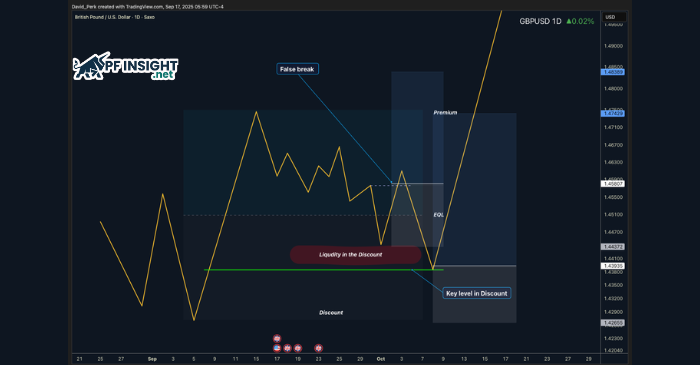
Liquidity being drawn into the discount zone before trend continuation within a dealing range
Real dealing range examples across markets
Understanding dealing range theory only becomes truly valuable when traders observe how the market reacts in real conditions. Below are typical examples that illustrate how price moves between premium and discount under the influence of liquidity.
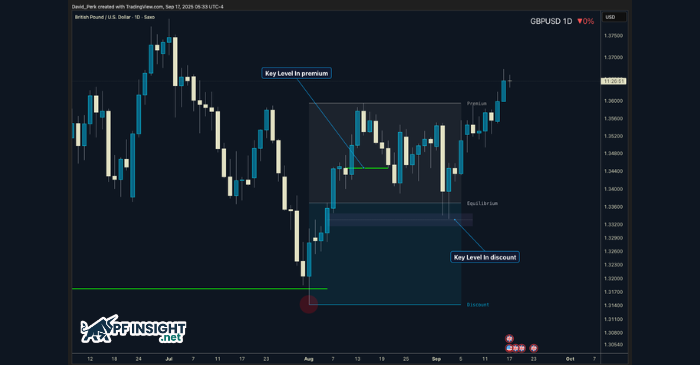
Example 1: Reactions from the premium zone
In the first example, price reacts multiple times at a key level located within the premium zone of the dealing range. From a technical perspective, the structure appears clean and often convinces traders that the market will continue higher immediately.
However, entering trades at premium increases risk and allows the market to build stop loss clusters below. Instead of continuing upward, price begins to reverse and moves toward the discount zone, where liquidity is truly concentrated.
This example highlights that relying solely on price patterns without considering position within the dealing range often leads to inefficient entries.
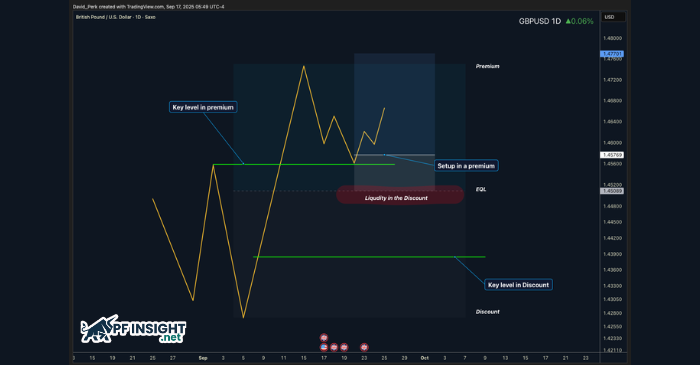
Example 2: Liquidity draw into discount
Price rotating into the discount zone to collect liquidity within a dealing range
In the second example, after several reactions near premium, the market starts accumulating liquidity beneath short term lows. Early buyers place stop losses relatively close to each other, forming a clear liquidity zone.
Price is then driven aggressively into the discount zone to sweep these orders. Once liquidity is fully collected, the market reverses quickly and expands strongly in the direction of the main trend.
This is classic dealing range behavior, where price consistently seeks optimal zones before initiating major moves.
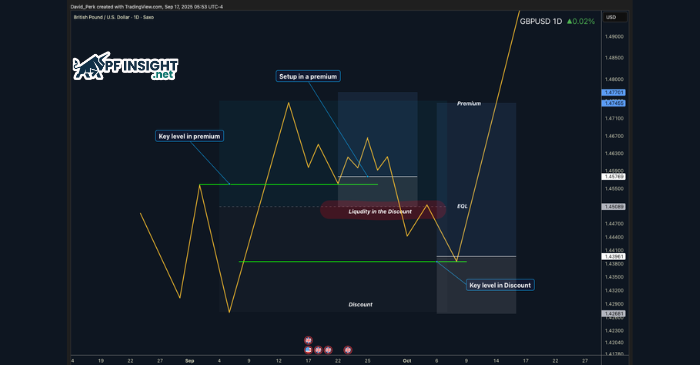
Example 3: High probability entry from discount
In this example, the trader patiently waits for price to return to the discount zone instead of entering early at premium. After liquidity below is swept and price reacts strongly at a key level within discount, the market begins a clear bullish expansion.
Entries in this area typically offer:
Short stop losses
High risk to reward ratios
Strong trend continuation probability
This is the core advantage of trading based on dealing range logic rather than emotional decision making.
Example 4: False breakout before continuation
False break trapping traders before price continues from the discount zone
The final example illustrates a very common false break within the dealing range. Price temporarily breaks a key structural level, leading many traders to believe that the trend has reversed.
In reality, the break is designed to attract additional liquidity. Shortly afterward, price returns back inside the range, sweeps stop losses, and accelerates in the original direction.
False breaks are an effective mechanism for liquidity generation before major expansions, and a frequent trap for traders who do not understand dealing range dynamics.
How to trade using a dealing range step by step
After understanding how a dealing range forms and the role of premium and discount zones, the next step is to turn this price framework into a systematic trading process. Below is how many professional traders apply dealing range concepts to improve precision.
1. Identify the dealing range on higher timeframes (HTF)
Start by switching to higher timeframes such as Daily, H4, or Weekly to define the market’s primary structure. On HTF, you should:
Look for clear sweeps of swing highs and swing lows
Identify a strong expansion move in one direction
Mark the high and low of that expansion as the dealing range
HTF analysis provides market context and helps avoid trading against the dominant trend.
2. Mark premium and discount zones
Once the dealing range is defined:
Divide the range into two equal halves
The upper half is the premium zone
The lower half is the discount zone
In an uptrend, focus on buying opportunities in discount
In a downtrend, prioritize selling in premium.
This step filters out poorly positioned entries from the start.
3. Wait for price to return to optimal zones
Instead of entering while the market is expanding aggressively, remain patient and wait for:
Price to retrace into discount during bullish flow
Price to pull back into premium during bearish flow
These retracements are typically driven by liquidity attraction and often present high probability entry opportunities.
4. Use lower timeframes (LTF) for entry confirmation
When price reaches an optimal zone on HTF, drop to lower timeframes such as H1, M15, or M5 to seek confirmation signals:
Short term structure breaks
Minor liquidity sweeps
Strong reaction candles
LTF execution allows tighter stop losses and more precise entries.
5. Manage risk and trade objectives
Common principles include:
Placing stop loss beyond the liquidity area that was just swept
Targeting equilibrium or the opposite boundary of the dealing range
Maintaining a minimum risk to reward ratio of 1:2 or higher
Disciplined risk management is the key to long term consistency when trading with dealing range logic.
Timeframe alignment for better accuracy
A dealing range loses much of its value if traders observe it on only a single timeframe. The market always operates through multi timeframe structure, where each timeframe reflects a different level of capital participation.
Higher timeframe – defining trading context
Higher timeframes such as Weekly, Daily, or H4 reveal:
Whether the market is in an uptrend, downtrend, or consolidation phase
Where the key dealing range is located
Whether price is approaching premium or discount within the broader structure
HTF analysis helps traders avoid trading against the dominant trend and focus on high probability zones.
Lower timeframe – refining entry execution
When price reaches an optimal zone on HTF, lower timeframes are used to:
Observe how price reacts to liquidity
Identify minor sweeps or structure breaks
Enter trades with tighter stop losses
Rather than guessing, traders wait for the market to provide confirmation before participating.
Effective timeframe combinations
Common multi timeframe models include:
Analyze the range on Daily and execute on H1 or M15
Analyze the range on H4 and execute on M15 or M5
Analyze the range on Weekly and trade using H4
Scaling across timeframes allows clearer insight into price behavior while reducing noise.
Advantages of multi timeframe alignment
When entries align across both HTF and LTF:
Win probability increases
Random stop loss sweeps are reduced
Risk to reward improves significantly
Trading decisions become more confident
Timeframe alignment transforms dealing range from a theoretical concept into a practical trading system.
Common mistakes traders make with dealing ranges
Trading in the middle of the dealing range where price lacks clear directional advantage and liquidity is unevenly distributed.
Entering long positions in the premium zone during bullish market structure instead of waiting for price to retrace into discount.
Selling in the discount zone during bearish conditions where liquidity is typically being built for a pullback toward premium.
Ignoring liquidity sweeps and focusing only on technical patterns without understanding where stop-loss clusters form.
Chasing breakouts inside or outside the dealing range without waiting for confirmation after liquidity has been collected.
Using a single timeframe to define dealing ranges instead of aligning higher and lower timeframe structure.
Placing stop losses at obvious technical levels where liquidity is most likely to be targeted.
Conclusion
Dealing range in trading provides a clear framework for understanding where price is positioned within market structure and liquidity flow. By combining premium and discount zones with liquidity analysis, traders can significantly improve entry timing and risk-reward performance. When applied across multiple timeframes, the dealing range becomes a powerful tool for consistent and disciplined trading decisions.