Traders often enter the market at the wrong time even after correctly identifying the bigger trend. A Bullish Pattern appears as an early signal to detect when buying pressure is coming back into the market. When this pattern forms, it often indicates a potential reversal from bearish to bullish or the continuation of upward momentum. Today at Pfinsight.net, we will walk through the 3 bullish patterns with the highest win rate to help you execute buy entries with more confidence and improve your trading strategy.
A bullish pattern is a price structure that shows buying pressure is gradually taking control, signaling that the market is about to enter a bullish phase. Instead of entering trades based on emotion, traders can use these patterns as early confirmation to identify safer entry zones. In real trading conditions, not every pattern works as perfectly as described in theory. That’s why instead of trying to memorize dozens of candlestick formations, traders should focus only on a few high-probability bullish patterns that are most commonly used in live trading.
Criteria for selecting high-probability bullish patterns
To choose the 3 most reliable bullish patterns, this guide is based on the following criteria:
Confirmed by volume or momentum: a pattern is only truly strong when it is backed by rising volume or momentum. This shows that buyers are genuinely entering the market, not just causing a temporary technical bounce.
Appears at key support zones or after a deep sell-off: reversal signals have the most value when they appear at a price zone with previous reactions or right after a strong sell-off where the market is more likely to bounce.
Used and backtested by many traders: the more a pattern is tested and used by experienced traders, the higher the real success rate.
Top 3 bullish patterns with the highest win rate
Morning star
What does the morning star candlestick pattern look like?
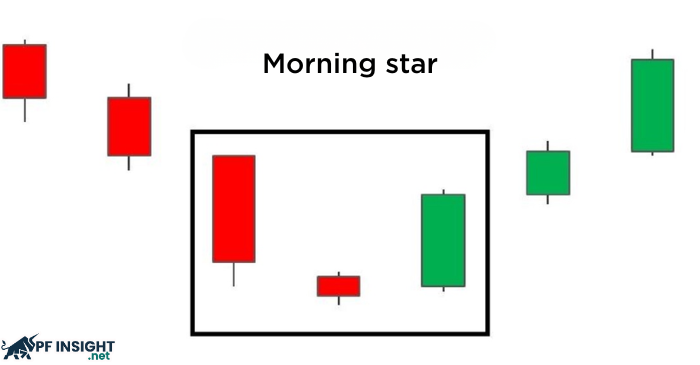
The morning star is a three-candle pattern that appears after a downtrend and is commonly used to forecast a bullish reversal with high accuracy.
How to identify the morning star pattern:
Candle 1: starts with a long bearish candle showing strong selling pressure that makes the market believe the decline will continue.
Candle 2: a small-bodied candle, bullish or bearish, showing market indecision.
Candle 3: a strong bullish candle closing near the midpoint of the first candle’s body, signaling buyers have taken control and a reversal is likely forming.
How to trade the morning star:
Entry: enter when the third candle closes above the midpoint of the first candle.
Stop loss: place below the low of the pattern (beneath the wick of candle two or candle one).
Take profit: target the nearest resistance zone or aim for a minimum r:r of 1:2.
When not to trade the morning star:
Appears in a ranging market without a clear trend.
No strong support zone below.
The third candle has a weak body or fails to break above 50 percent of candle one, indicating weak buying pressure.
Bullish engulfing
What is a bullish engulfing candlestick?
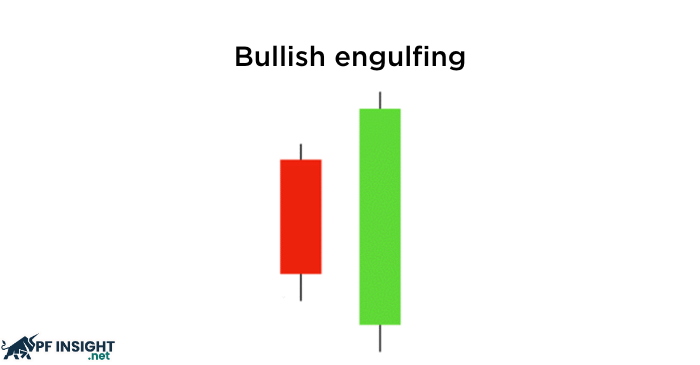
Bullish engulfing is a two-candle pattern commonly appearing at the end of a downtrend, signaling potential reversal as strong buying pressure completely engulfs previous selling momentum.
How to identify the bullish engulfing pattern:
Candle 1: a small bearish candle showing sellers are still in control but losing strength.
Candle 2: a strong bullish candle whose body fully engulfs the first candle, clearly showing that buyers have regained control.
How to trade bullish engulfing:
Entry: enter when the second candle closes or wait for a slight pullback into its body for a better entry.
Stop loss: place below the low of the engulfing candle or slightly under candle one to avoid being stopped out.
Take profit: target resistance zones or use r:r 1:2 or 1:3 if bullish momentum is strong.
When not to trade bullish engulfing:
Forms in the middle of an uptrend where reversal context is invalid.
The engulfing candle has a small body or a long upper wick, showing weak buying pressure.
No key support level below, increasing the chance of fake breakouts.
Volume does not increase on the engulfing candle, which signals weak confirmation.
Hammer
What is a hammer candlestick?
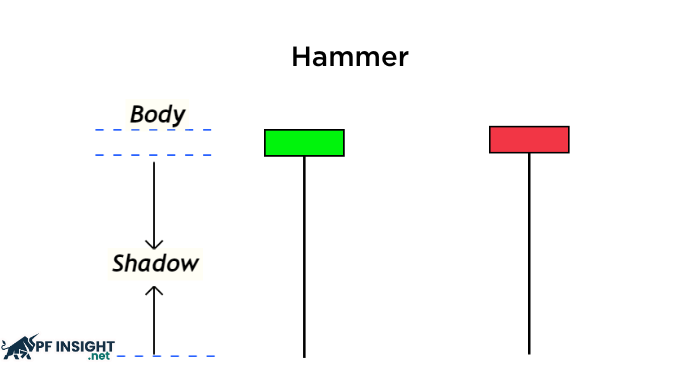
The hammer is a single-candle pattern that appears after a strong decline, signaling selling exhaustion and the potential start of a bullish reversal as buyers push back from the bottom. The hammer is most effective when it forms at key support zones or after a series of strong bearish candles.
How to identify the hammer pattern:
A small body located near the top of the candle range, showing that price was pushed back up after a deep drop.
The lower wick is at least 2 to 3 times the body size, showing sellers tried to push down but failed to maintain control.
Little to no upper wick, clearly showing bullish rejection of lower prices.
How to trade the hammer:
Entry: enter when price breaks above the high of the hammer. or wait for a pullback to 50 percent of the candle body for a better entry (advanced strategy).
Stop loss: place below the wick low to avoid stop hunts.
Take profit: target the nearest resistance. If the hammer forms at the bottom of a major trend, consider holding and trailing stop using ema or market structure.
When not to trade the hammer
Forms in a sideways market with no clear trend.
No breakout above the candle high, meaning no confirmation of buying pressure.
Volume does not increase, which often indicates a technical bounce instead of a true reversal.
Conclusion
A bullish pattern is an early signal that helps traders detect buying pressure before the market makes a strong move. However, you do not need to learn too many patterns. mastering just 1 to 2 bullish reversal candlestick patterns and practicing them in the same market conditions is far more effective. Candlestick patterns should not be used alone. They perform best when combined with technical indicators and other market analysis tools to provide a more complete view of market psychology.
To optimize your win rate, ask yourself during practice:
Should I backtest this pattern to check its reliability?
If I combine it with price action or volume, does the signal become stronger?
Once you verify with your own trading data, the pattern will no longer be theory but a precise entry tool that removes emotion from your decision-making. View more of our technical analysis articles here.