Many traders incur losses by trying to catch tops and bottoms while ignoring signs that the market structure has already changed. Break of structure trading addresses this issue by waiting for clear confirmation from price action before entering a trade. When the structure is broken, it often signals that either buyers or sellers have taken control of the market. In this article, pfinsight.netwill guide traders on how to identify BOS for more effective and systematic trading.
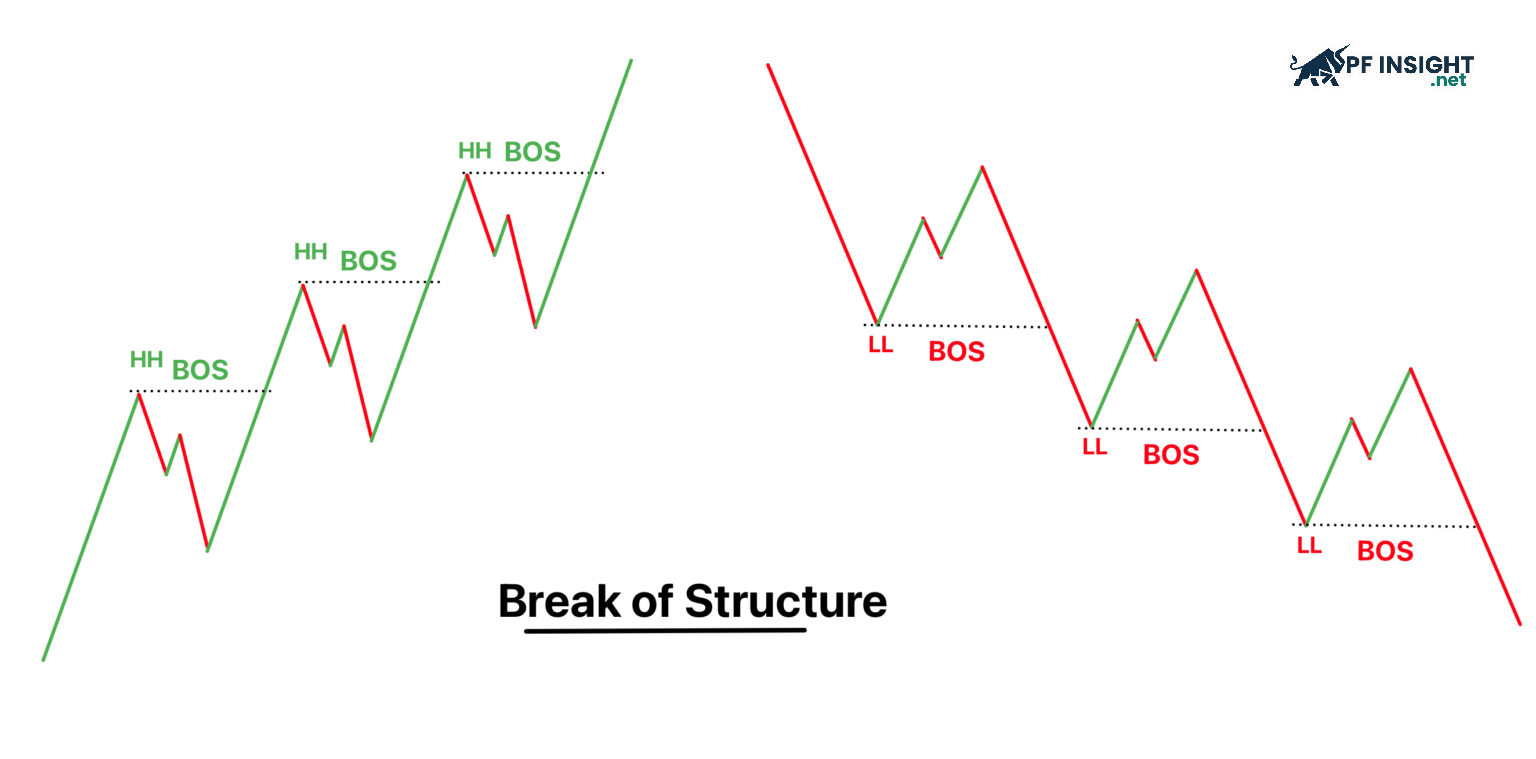
Break of Structure (BOS) occurs when price clearly breaks a key high or low within the previous trend structure. This movement indicates that the market is no longer maintaining its prior state, but that one side buyers or sellers has gained dominance. When price moves beyond an important previously formed level of resistance or support, BOS serves as a confirmation of trend strength and provides traders with clearer directional guidance.
BOS is one of the core components of the ICT methodology, helping traders identify when the market is genuinely changing direction. When the structure is broken after a period of low liquidity, it often indicates that large institutional players have shifted their positions. By using BOS, traders can avoid false breakouts and adjust their strategies to the new trend with greater confidence and reliability.
Classification of break of structure in trading
Break of Structure trading includes three main types: breaks in an uptrend, breaks in a downtrend, and false breaks. Each type reflects a different scenario of change within the market structure. Specifically:
Bull break of structure – Bull BOS
Bull break of structure – Bull BOS
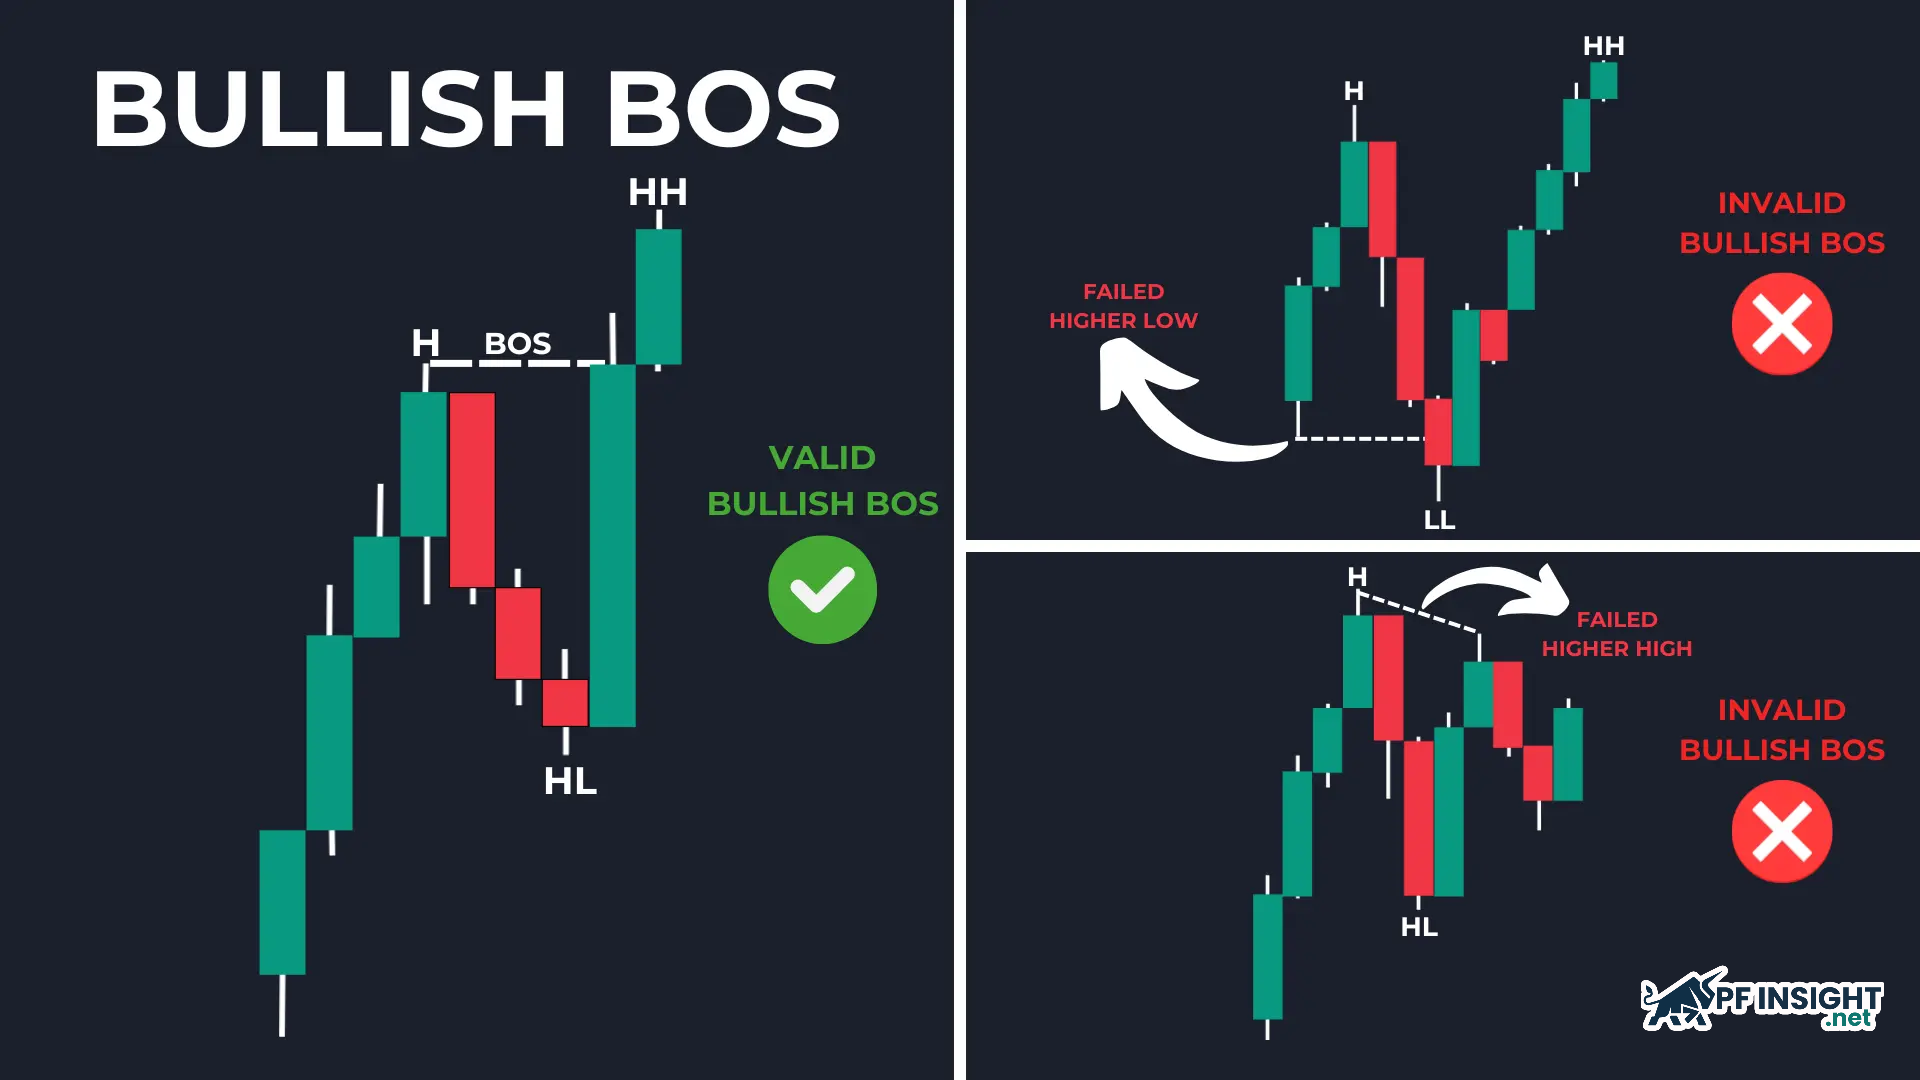
When the market is in an uptrend, the price structure is confirmed by Higher Highs and Higher Lows. A bullish break of structure occurs when price breaks above the previous high and holds above that resistance level. This signal indicates that bullish momentum remains strong and that the current trend has a solid basis to continue.
When a candle closes above the prior high, it confirms that buyers are still in control. Buying pressure has not weakened, and the bullish structure remains intact. In this situation, many traders choose to trade with the trend by entering long positions or adding to existing buy trades.
Characteristics of Bull BOS:
The price broke through the previous high and the candle closed well above that high, indicating a clear and valid structural breakout.
The price may break above the previous high using only the candle wick, but if the candle body still closes above the previous high, this signal is still considered a valid breakout of the structure.
Before a breakout of the peak occurs, the market often sweeps through liquidity, triggering stop-loss orders from retail sellers, thereby creating conditions for the BOS to form more clearly and reliably.
Bear break of structure – Bear BOS
Bear break of structure – Bear BOS
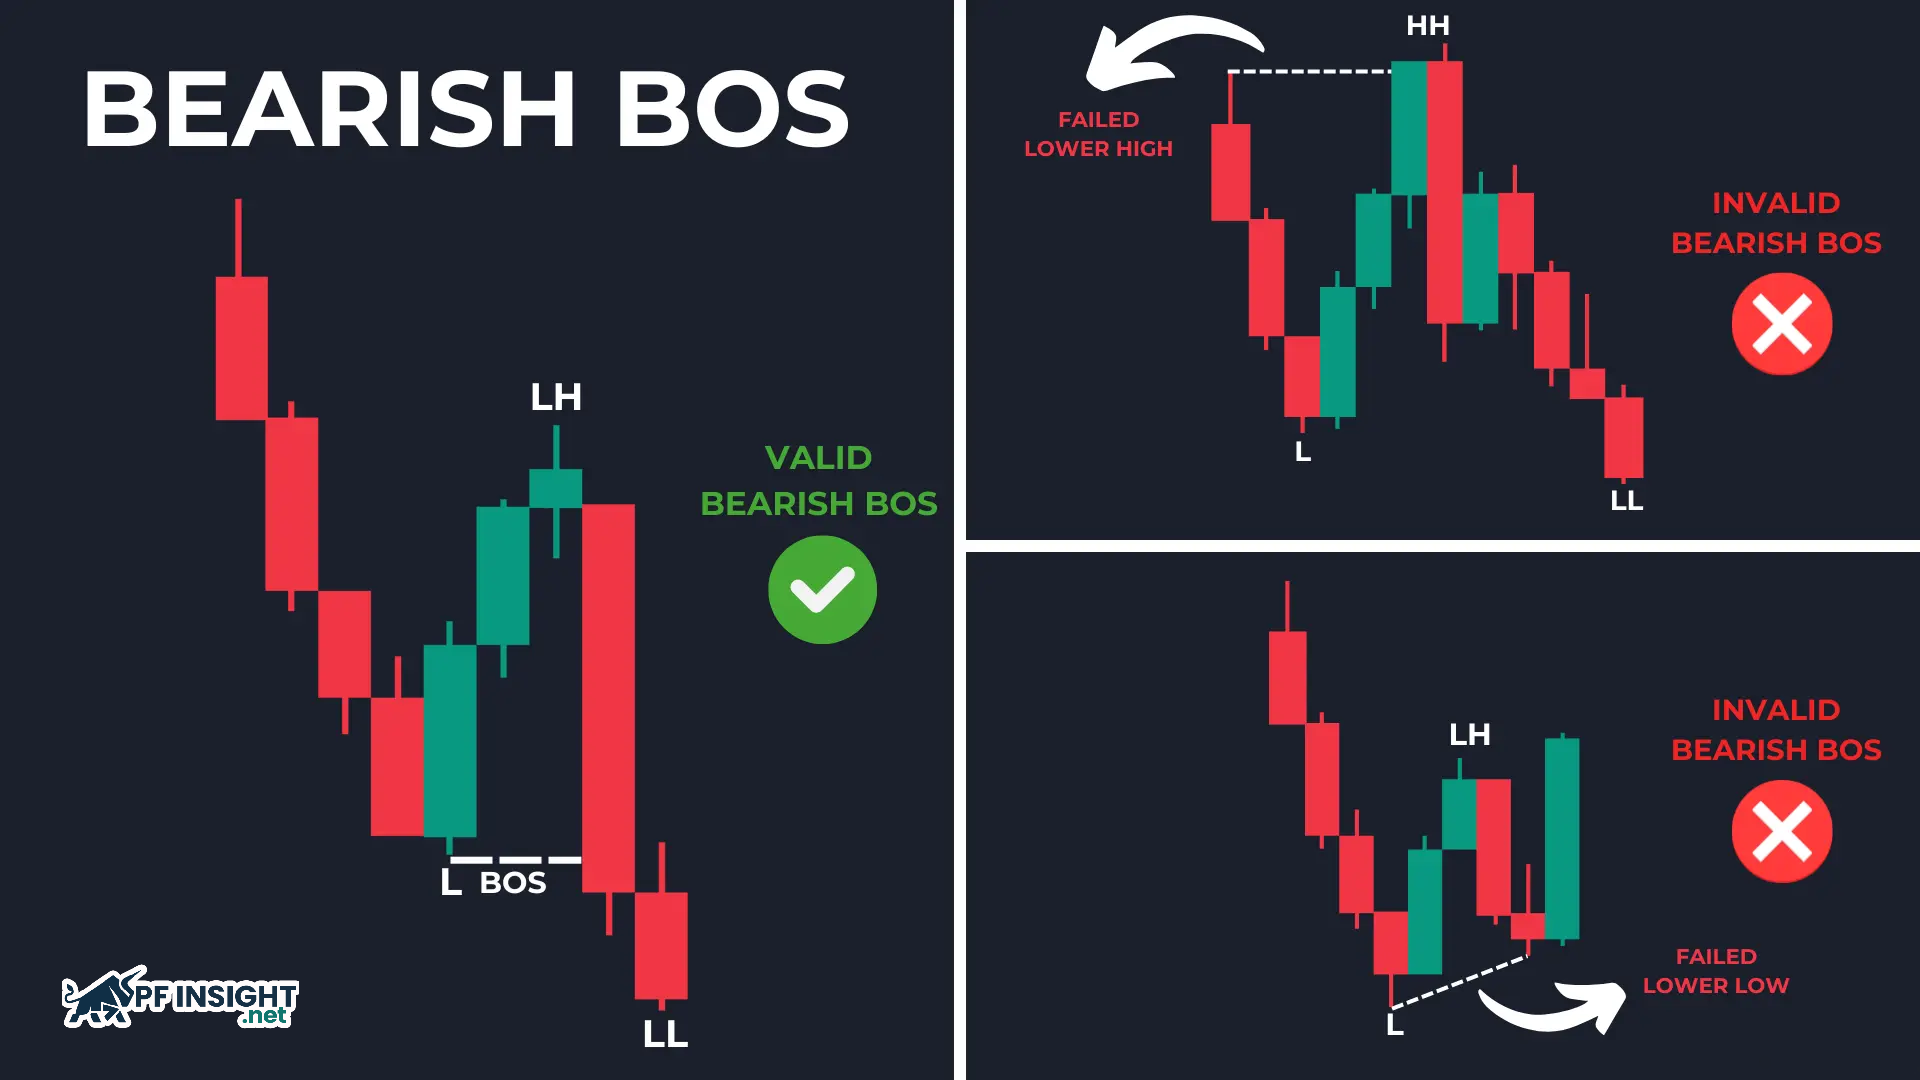
When the market is in a downtrend, the price structure typically maintains lower highs and lower lows. A price breakout below the previous low and remaining below this level is considered a bearish breakout. This signal confirms that selling momentum remains strong and the downtrend shows no signs of ending.
Features of Bear BOS:
The price broke through the previous low and the candle closed completely below this area, confirming a bearish breakout of the structure.
Before or during a breakout, the market may sweep liquidity below the previous low, triggering stop-loss orders from retail buyers.
A decline in BOS is often accompanied by confirming signals from price action, such as bearish engulfing candles, bearish pin bars, or reversal patterns indicating increasing selling pressure.
Fake BOS
The market sometimes creates misleading breakouts, leading traders to mistakenly believe the trend has changed. Price may break through a key structural level but lack sustained momentum and quickly reverse. This is a false breakout, a common trap for those who enter trades too early. To avoid this, traders should use additional confirmation factors such as candlestick closing levels, structure retests, or volume analysis to increase reliability.
The importance of break of structure trading
Break of structure trading helps traders determine whether the market is maintaining its current trend or preparing for a reversal. Early identification of structural changes provides a significant advantage in selecting the most appropriate trading direction.
Market trend forecasting: By identifying break of structure signals, traders can assess whether the current trend is likely to continue or is approaching a potential reversal. Understanding changes in price structure allows traders to proactively adjust their strategies and prepare for possible future market scenarios.
Reducing counter-trend trades: Without a clear BOS, traders are more likely to enter positions too early in anticipation of a reversal and get caught by stop-loss sweeps. In contrast, a valid BOS acts as confirmation that the primary trend remains intact, encouraging traders to stay patient and wait for suitable entry zones to trade in the direction of the trend.
Trading in line with market maker behavior: When a break of structure signal is confirmed, it suggests that market makers or large capital flows are supporting the current price direction. This allows traders to align their strategies with market movement, making trend-following trades more logical, consistent, and confident.
Identifying entry and exit points: Breakout of structure acts as a crucial marker to determine when to enter or exit the market. In an uptrend, a bullish BOS is often seen as a support signal to open or hold a buy position. Conversely, a bearish BOS in a downtrend may suggest a time to sell or close existing buy orders.
Applying break of structure trading consistently allows traders to stay aligned with the market’s primary driving forces. Instead of relying on subjective predictions, traders use price structure to adapt their strategies accordingly, improving their ability to capture trends and increasing the potential for successful trades.
Methods to recognize market structure breaks
Understanding and applying break of structure in real trading helps traders read shifts in market trends. Correctly identifying BOS at the right time clarifies whether the market is continuing its move or preparing for a reversal. Below are five simple steps to help traders identify BOS effectively across all timeframes.
Methods to recognize market structure breaks
Step 1: Locate important swing points on the chart
The first step in break of structure trading is identifying key swing highs and swing lows. These are areas where the market previously reversed due to strong participation from buyers or sellers. A structure break is only considered valid when price decisively moves beyond these levels and is able to hold above or below them.
Step 2: Plot market structure levels
Draw support and resistance levels based on significant price swings. These levels reflect how the market has reacted in the past. When price approaches these areas, traders should pay close attention, as they are common zones where valid Break of Structure signals tend to appear.
Step 3: Wait for a structure break
In break of structure trading, a break is only valid when a candle fully closes beyond a key resistance or support level, rather than merely touching it or forming a wick. This confirmation shows that market control has clearly shifted between buyers and sellers. Waiting for a candle close helps traders filter out false breakouts and avoid premature entries.
Step 4: Confirm the break with volume
After a structure break occurs, traders should check trading volume to confirm the signal’s validity. A reliable Break of Structure is often accompanied by a noticeable increase in volume, indicating participation from large capital. If volume remains weak or fails to expand, the move is more likely a false break or a short-term liquidity sweep.
Step 5: Assess the break through price behavior
Finally, break of structure trading should be reinforced by reliable price action signals. Candlestick patterns that show strong momentum in the direction of the break help confirm that the market is moving with clear intent. This allows traders to distinguish between a valid structure break and noisy or random price movements.
When is a BOS considered valid?
Not every breakout is a valid trade. Experienced traders always consider the quality of the breakout to determine whether it’s a genuine signal or just short-term market noise. Here are two signs that indicate a valid breakout:
Comparing candle body and wick
A crucial aspect of break-of-structure trading is how the price actually breaks out of the structure, as this determines whether the signal is valid or simply market noise.
Body close break: A BOS is considered strong when the candle closes completely above the previous high in an uptrend, or below the previous low in a downtrend. This reflects clear market consensus and shows that control has genuinely shifted, making the signal more reliable.
Wick break: In many cases, price only touches or briefly pierces a previous high or low with a wick before quickly reversing. These moves are often liquidity sweeps rather than true structural breaks. Confusing a wick break with a valid BOS is a common mistake that can lead traders to enter too early and fall into market traps.
Reading market structure across multiple timeframes
BOS across multiple timeframes
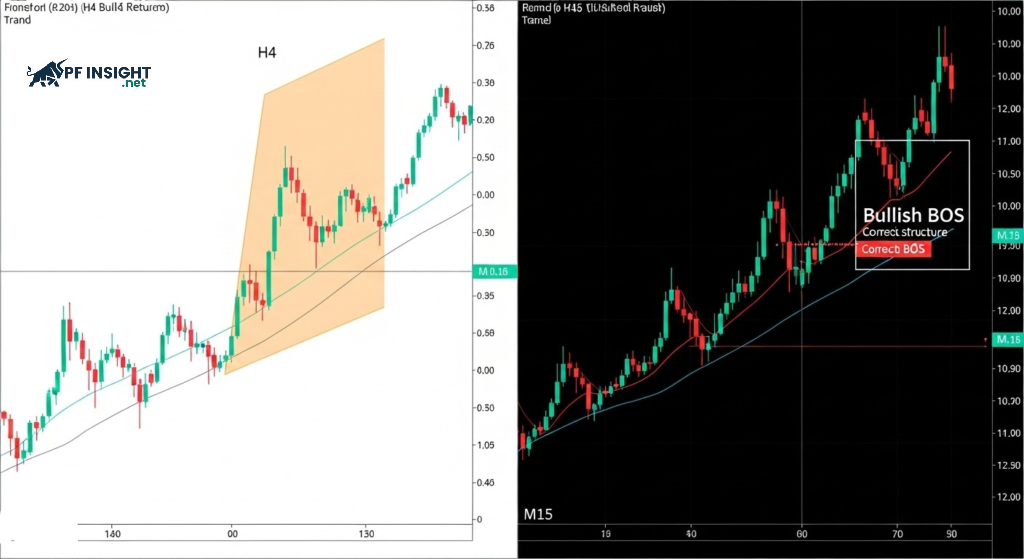
A Break of Structure that appears on the 5-minute timeframe carries limited value if it goes against the trend on the 4-hour chart. Placing signals within the correct broader market context is always a key factor. A sound process typically includes:
Identify the primary trend on a higher timeframe (HTF): Focus on timeframes such as H4 or Daily, as the structure and trend on these charts are more reliable and have a stronger influence on overall price behavior.
Look for BOS signals on a lower timeframe (LTF) in the same direction as the HTF: When the H4 trend is bullish, traders should wait for a bullish BOS to form on lower timeframes such as M15 to enter trades in alignment with the main trend.
Multi-timeframe confluence provides a significant edge for traders. A BOS on a lower timeframe loses much of its value if it conflicts with the structure of a higher timeframe. This is similar to swimming against a strong river effort is high, but effectiveness is low.
Key differences between BOS and Change of Character (CHoCH)
Many traders often confuse these two concepts, leading to inaccurate trading decisions. Misunderstanding BOS and CHOCH can cause you to enter trades in the wrong direction, especially when the market is about to shift from an uptrend to a downtrend or vice versa.
Break of Structure (BOS): BOS represents the continuation of the current trend. This signal appears when the price breaks through a significant high or low in the same direction as the main trend. For example, in an uptrend, the price breaking above the previous high (Higher High) confirms that buying pressure is still dominant.
Change of Character (CHoCH): CHoCH is a sign that market behavior is changing, often appearing before a reversal. It occurs when the price breaks out of a structure in the opposite direction of the existing trend, indicating that the supply-demand balance is beginning to shift.
To better understand the difference between BOS and CHOCH, let’s consider the following example:
Key differences between BOS and Change of Character (CHoCH)
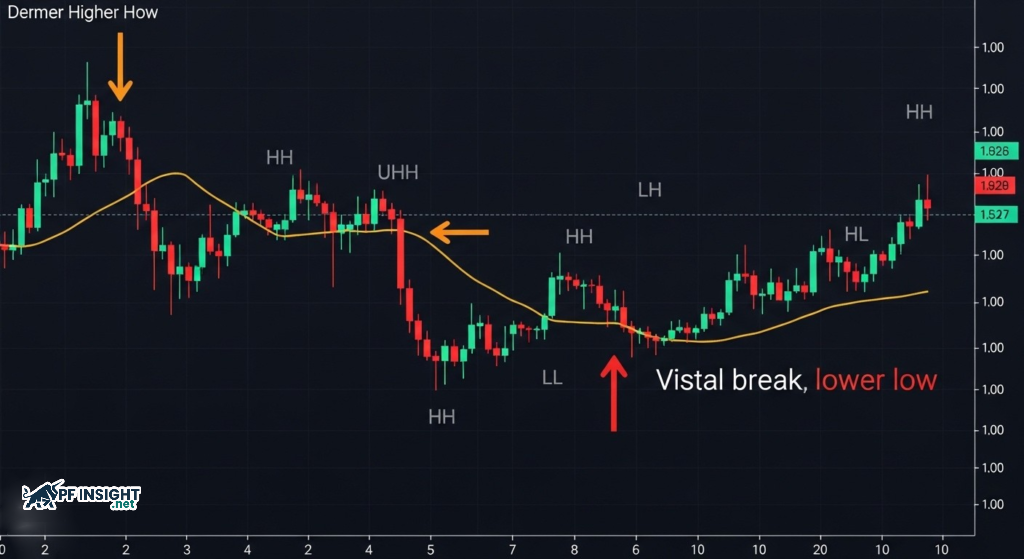
In an uptrend with a series of higher highs (HH) and higher lows (HL), if the price fails to form a new HH and instead reverses to break through the nearest HL low, it is no longer a continuation signal. This action is called CHoCH, reflecting a clear weakening of buying pressure. When the uptrend structure is broken in this way, the market shows that sellers are gradually gaining the upper hand, an early warning sign of the potential end of the uptrend.
When CHoCH appears, traders should lower their expectations for buy orders and switch to a cautious observation mode. Conversely, BOS acts as confirmation of the continuing trend, giving traders more confidence to maintain or increase positions in the current direction.
Effective trading strategies using break of structure (BOS)
To maximize the effectiveness of break of structure trading, traders should avoid using it in isolation. Combining BOS with supporting tools such as moving averages and candlestick patterns helps filter out noise and increases reliability when anticipating the next price move. Below is a simple, practical approach to applying this method.
Effective trading strategies using break of structure (BOS)
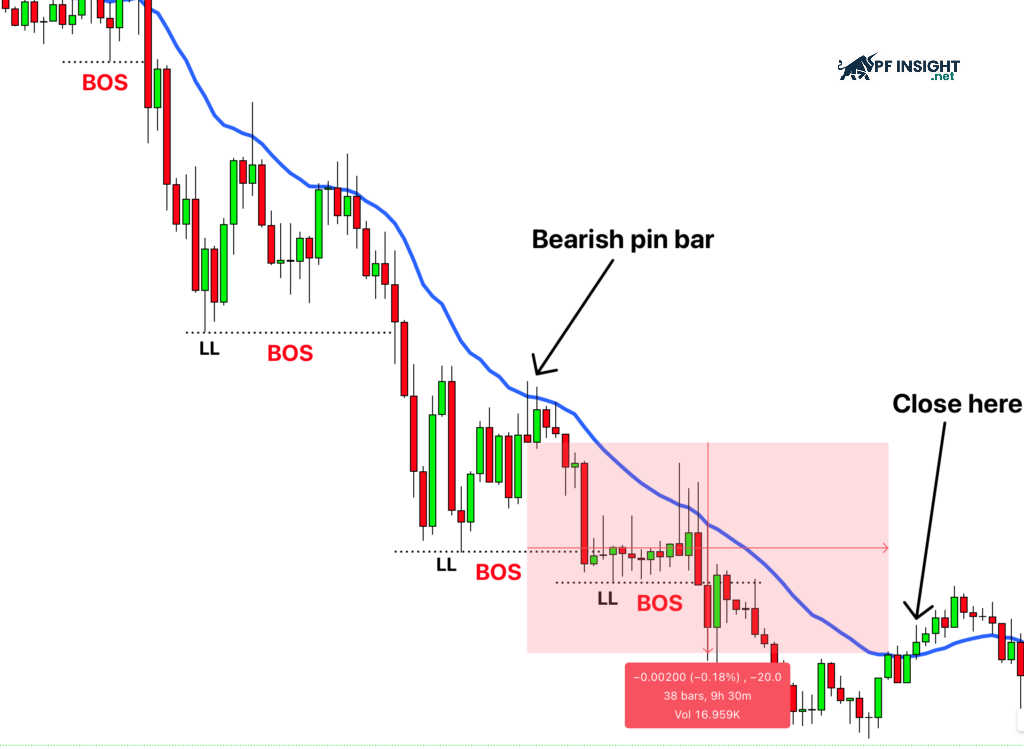
Initial setup: First, identify clear Lower Highs (LH) and Lower Lows (LL) to confirm that the market is in a downtrend. Then, add the 21-period Exponential Moving Average (EMA 21) to the chart as a trend confirmation tool.
Identifying BOS: A Break of Structure occurs when price breaks and closes below the previous lower low. This indicates that selling pressure is in control and that the downtrend is likely to continue.
Entering short positions: After a bearish BOS, wait for confirmation from price action, such as a bearish engulfing pattern or a bearish pin bar. This is an appropriate point to open a short position.
Trade management and exit: Monitor how price reacts around the EMA 21. When price closes above the EMA, it may signal weakening bearish momentum and can be a cue to consider exiting the trade.
Common mistakes when trading BOS
Understanding structure break trading is not just about identifying effective signals, but also about knowing when market structures become ineffective and prone to distortion.
BOS in a ranging market: When the market lacks a clear trend, breaks above or below the boundaries of a consolidation range are often fakeouts designed to trigger liquidity, rather than genuine changes in market structure.
Ignoring momentum: A BOS formed by strong candles with large bodies and decisive closes is far more reliable than weak breaks created by a series of small, indecisive candles.
Confusing liquidity sweeps with BOS: Situations where price briefly moves beyond a previous high or low with only a wick and then quickly reverses are very common. This is a subtle trap, which is why traders should always wait for confirmation from the candle body close.
Conclude
Break of structure trading is a tool that helps traders read changes in market structure rather than rely on subjective judgment. However, BOS is only effective when placed within the proper context of trend, momentum, and liquidity. Understanding when BOS works and when it fails allows traders to avoid false breakouts, improve trade probability, and build more sustainable strategies over time.