Breakouts often attract aggressive entries, but not every breakout leads to a sustained trend. Many traders struggle with timing, especially when price moves quickly beyond key support or resistance levels. The break and retest strategy offers a more structured approach by waiting for the price to return to the broken level before committing to a position. This method focuses on confirmation, risk control, and alignment with broader market structure. In this article from Pfinsight.net, we examine how the break and retest strategy works after a breakout and how traders can apply it with greater discipline.
- Range trading strategy with clear entry and exit rules
- Trend continuation strategy explained: how it works in strong trends
- Risks and mistakes in counter trend trading strategies
The psychology behind breakouts and retests
A breakout represents a shift in market sentiment. When price closes decisively above resistance or below support, it signals that one side of the market has gained control. Buyers overpower sellers in a bullish breakout, while sellers dominate in a bearish one.
However, markets rarely move in a straight line. After a breakout, price often pulls back toward the broken level. This happens because traders who missed the initial move look for a better entry, and others take partial profits. The previous support or resistance level may then act as a new decision zone. This role reversal is the foundation of the break and retest strategy.
The retest serves as a validation phase. If the broken level holds, it suggests that the breakout was genuine rather than a temporary spike.
Market conditions where the strategy works best
The break and retest strategy performs best in trending environments. In strong trends, breakouts are more likely to continue after a pullback. Traders can assess trend strength using tools such as moving averages, higher highs and higher lows, or lower highs and lower lows.
Volume expansion is another important factor. A breakout supported by increased trading volume signals strong participation. Without volume confirmation, breakouts are more vulnerable to failure.
The strategy is less reliable in sideways or highly choppy markets. In ranging conditions, price may frequently break levels only to reverse quickly. Identifying overall market structure before applying the strategy is essential.
A structured framework for trading a breakout retest
- Define key structural levels: Start by identifying significant support and resistance levels on your chart. These levels should be based on clear swing highs, swing lows, or areas where price has reacted multiple times. Accuracy at this stage is critical because the entire setup depends on the validity of these levels.
- Validate breakout strength: Wait for a decisive breakout. Strong breakouts typically close beyond the level with conviction and may be accompanied by higher volume. Avoid entering during the breakout candle itself, as this can expose you to unnecessary risk.
- Wait for the pullback: After the breakout, price often retraces to the broken level. Patience is essential here. Entering too early defeats the purpose of the strategy, which is to trade with confirmation rather than anticipation.
- Confirm continuation: During the retest, look for confirmation signals. These may include bullish or bearish candlestick patterns such as pin bars or engulfing candles. Momentum indicators like RSI or MACD can also provide additional insight into trend continuation.
- Execute with defined risk: Once confirmation appears, enter the trade with a clearly defined stop loss. In a bullish scenario, stops are often placed below the new support. In a bearish setup, stops are typically placed above the new resistance. Targets can be set using previous swing levels or a predefined risk-to-reward ratio.
Real trading example: EURUSD breakdown scenario
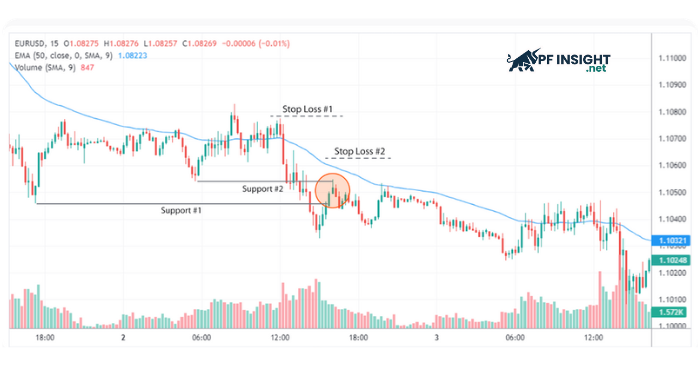
Consider a EURUSD 15-minute chart showing a clear bearish trend. The 50-period exponential moving average slopes downward, and price consistently trades below it. A key support level is broken on higher than average volume, signaling strong selling pressure.
1. Market context
- Bearish structure with lower highs and lower lows
- Price trading below the 50-period EMA
- Momentum aligned with downside continuation
2. Breakout confirmation
- A significant support level is broken
- The breakout occurs with higher than average volume
- Sellers demonstrate strong participation
3. Retest scenarios
After the breakdown, the price retraces toward the broken support. Two potential retest areas appear:
First retest level
- The major structural support that was initially broken
- Allows quicker entry
- Produces a less favorable risk-to-reward ratio
Second retest level
- Forms within a smaller internal retracement
- Offers improved reward relative to risk
- Carries the risk of price not retracing deeply enough
4. Entry trigger
- A pin bar forms during the retest
- The candle shows rejection of higher prices
- Bearish continuation is confirmed after candle close
- A short position is entered at market close
5. Risk management
- Stop loss placed above the recent swing high
- Alternative stop above the 50-period EMA
- Take profit set at a 1 to 3 risk-to-reward ratio
- Secondary target at the next significant support level
Confirmation tools and confluence factors
The break and retest strategy becomes significantly more reliable when combined with additional layers of analysis. While no indicator can eliminate risk, confluence helps traders filter weaker setups and focus on high-quality opportunities.
Momentum indicators such as the Relative Strength Index can provide insight into whether the market still supports the breakout direction during the retest phase. In a bearish breakout, an RSI reading that moves below 50 during the pullback suggests that downside momentum remains intact. In bullish scenarios, RSI holding above 50 reinforces the strength of buyers and supports continuation. The key is not whether RSI reaches extreme levels, but whether it aligns with the structural shift created by the breakout.
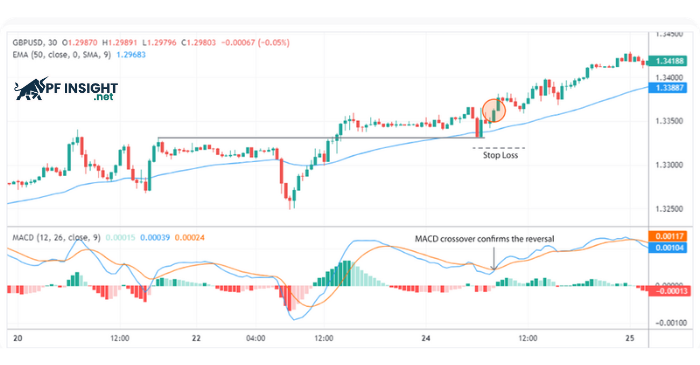
The Moving Average Convergence Divergence can also help validate continuation. A bullish crossover, where the MACD line moves above the signal line, may confirm upward strength after a breakout and retest. Conversely, a bearish crossover can reinforce downside continuation. Expansion of the MACD histogram further strengthens the case that momentum is building in the direction of the breakout.
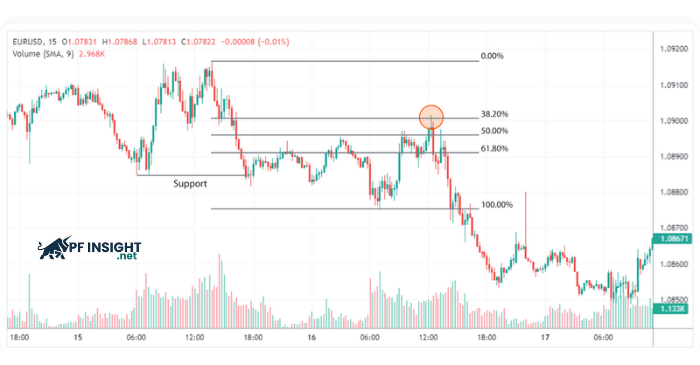
Fibonacci retracement levels offer another layer of structure. After a breakout, price often retraces into a portion of the previous impulse move rather than returning fully to the origin. The 38.2 percent, 50 percent, and 61.8 percent retracement levels are frequently observed during pullbacks. When a retest aligns with one of these levels and coincides with a former support or resistance zone, the setup gains additional technical confluence.
Multi-time frame analysis adds broader context. A breakout observed on a lower time frame becomes more reliable when it aligns with a clear trend on a higher time frame. Structural agreement across time frames reduces the probability of false breakouts and strengthens conviction in the trade direction.
Finally, fundamental catalysts can reinforce technical setups. Economic data releases, interest rate decisions, or macroeconomic developments may provide the momentum necessary for a breakout to sustain follow-through. When technical structure and fundamental drivers align, the probability of continuation often increases, particularly in forex markets.
Risks and limitations of the break and retest strategy
Despite its advantages, the strategy is not foolproof. False breakouts remain one of the main risks. Price may break a level briefly and then reverse sharply.
Sideways markets reduce reliability. In ranging environments, repeated breakouts can trap traders on both sides.
Timing the retest is another challenge. Sometimes price does not return to the broken level, causing traders to miss opportunities. In other cases, entering too early during the pullback increases exposure to deeper retracements.
Emotional discipline is critical. Traders must resist the urge to chase breakouts or abandon their plan during minor fluctuations.
Conclusion
The break and retest strategy provides a structured method for trading after a breakout. By waiting for the price to return to a broken level and seeking confirmation, traders can improve entry timing and define risk more clearly. The strategy performs best in trending markets supported by strong volume and broader structural alignment. While false breakouts and challenging market conditions remain risks, disciplined execution and proper risk management can enhance long-term consistency. Understanding how the break and retest strategy works after a breakout allows traders to approach market moves with greater patience and clarity.
For more in-depth trading insights and structured strategy breakdowns, explore additional articles in the Knowledge Hub to continue refining your market approach.


