Boom and crash are two indicators that reflect the extreme fluctuations of assets in a short period of time, often appearing with sudden sharp increases or sharp decreases. In this article, PF Insight will help traders understand what Boom and crash are, how to read charts effectively, and introduce optimal trading strategies to exploit opportunities from these indicators.
What is boom and crash?
Boom and crash are a group of synthetic indicators developed by the Deriv trading platform that simulate the movements of real financial markets. Through these indicators, traders can predict and take advantage of price movements in a simulated environment, without having to directly participate in traditional financial assets or instruments such as Forex or stocks.
These indicators are generated from a random number system that operates on a highly secure algorithm. As a result, no trader or broker can interfere or predict the results, ensuring transparency in all price fluctuations.
What is boom and crash?
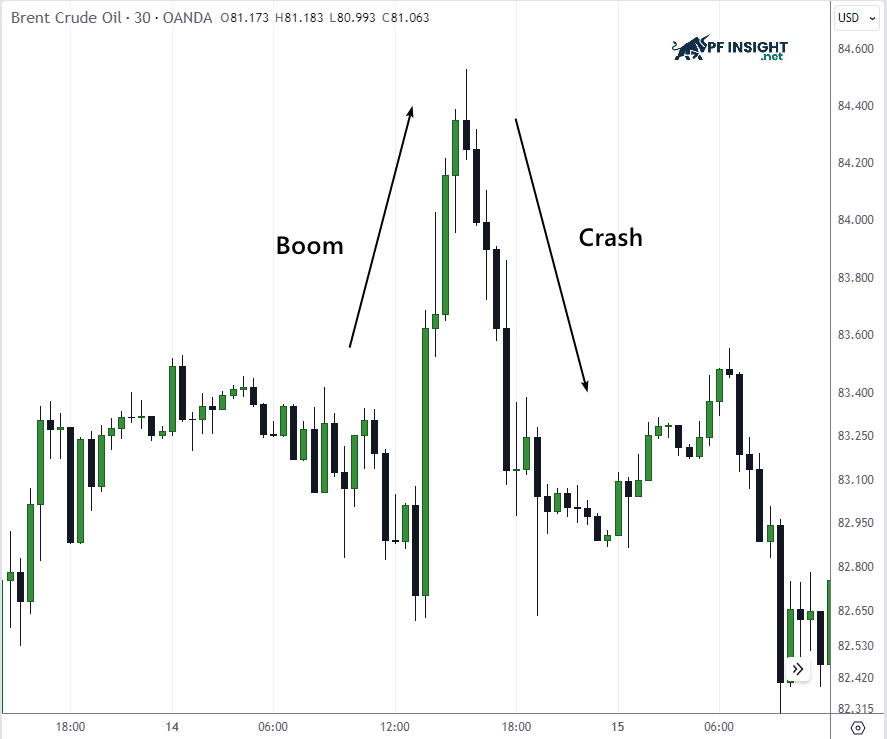
Boom: This is an index where the price usually moves steadily up for a period of time, followed by a strong spike called a “spike”. The characteristic pattern of a Boom is a continuous uptrend interspersed with short but very strong price explosions.
Crash: In contrast to Boom, Crash occurs when prices tend to fall sharply after a short period of increase. The characteristic pattern of Crash is sudden drops, then prices bounce back, creating fast and strong fluctuations in a short period of time.
Traders can use Boom and Crash to take advantage of continuous price fluctuations. These indicators mimic the movements of major markets such as Forex, commodities, and cryptocurrencies. Due to their high volatility, they are only available on the Deriv platform.
Factors affecting the Boom and crash index
In fact, there are many different factors that can influence the formation and fluctuations of Boom and crash phases during trading, specifically:
Market information and events: Breaking news, new policies, economic fluctuations or global events can have a strong impact on Boom and Crash. In response to this information, the market often shows unusual volatility, leading to rapid increases or decreases in prices in a short period of time.
Support/Resistance breaks: Technical factors play an important role in determining Boom and Crash movements. When important price zones such as support or resistance are broken, it often signals a change in trend and provides an early signal for strong market movements.
Market sentiment fluctuations: Market fluctuations are also greatly influenced by trader psychology. When emotions such as fear, excitement or greed overwhelm reason, buying and selling decisions become uncontrolled, leading to strong and unpredictable fluctuations in the short term, making prices prone to erratic fluctuations.
Low liquidity: Low liquidity is also a factor that increases Boom and Crash volatility. When the market lacks trading volume or has limited orders, even a single large transaction can have a strong impact on the price direction, causing sudden increases or decreases.
Macroeconomic developments: Changes in the global economic landscape, such as monetary policy adjustments, geopolitical tensions, or interest rate fluctuations, can impact booms and crashes. These factors often increase market volatility, affecting investor sentiment and trading behavior.
FOMO phenomenon: Discussions, rumors or viral trends online can quickly trigger massive buying or selling waves, creating strong fluctuations in short periods of time and directly affecting market sentiment.
Earnings Reports: Corporate earnings reports can trigger booms and crashes. When earnings results deviate significantly from market expectations, prices often react strongly, creating sharp spikes or crashes shortly after the announcement.
In short, any unexpected event that can cause a Boom and Crash or change the liquidity balance can trigger a sharp price increase or sharp decline in the market. However, predicting exactly when these fluctuations will occur is extremely difficult, even for experienced traders.
Boom and crash chart analysis guide
To read Boom and crash charts effectively, especially for beginners, you need to understand the following 5 steps:
Boom and crash chart analysis guide
Step 1: Determine the direction of the market
First, you should observe the overall movement direction of the Boom and crash index. Identifying the trend helps traders determine whether the market is leaning towards uptrend or downtrend. You can apply tools such as trendlines or track price movements over different time frames to identify more clearly.
For example, with the Boom indicator, when the price moves continuously in an upward direction, it is a sign that the market is forming an uptrend. On the contrary, in the Crash indicator, if the price continuously decreases over a period of time, this reflects that the market is falling into a clear downtrend.
Step 2: Watch for spikes
Once you have identified the main trend, focus on observing the strong fluctuations of Boom and crash. Spikes – sudden and rapid price changes often appear with large amplitude, far beyond normal movements and can create short-term trading opportunities for traders.
For example, a Boom occurs when prices rise sharply in a short period of time and then quickly reverse and fall. Conversely, a Crash occurs when prices suddenly fall before bouncing back, creating the fast and unexpected price movements characteristic of these two indices.
Step 3: Combine technical indicators to confirm the signal
To analyze price behavior on Boom and crash charts more accurately, traders should apply technical tools to confirm trends or identify times of strong volatility. Some popular indicators often used in trading are:
RSI (Relative Strength Index): This indicator helps assess the strength of the current trend. When RSI exceeds a high threshold, the market may be in an overbought state, conversely, when RSI falls low, it indicates an oversold state – a time when Boom and crash are likely to occur.
Moving Average: Moving Average is a useful tool to identify the overall direction of the market. When the price is above the average line, it reflects an uptrend, conversely, if the price is below, the market may be in a downtrend or correction phase.
Bollinger Bands: This is a tool that helps identify the volatility of Boom and crash. When the band narrows, it shows that the market is in an accumulation phase with low volatility, often signaling the possibility of a strong price breakout.
Step 4: Check the signal on the time frame
Timeframes are key when analyzing Boom and crash charts. Choosing the right timeframe will determine how much information is displayed, affecting how trends, sharp swings, and potential entry points are identified on the chart.
Small timeframes: Short timeframes such as M1, M5, M15 are suitable for traders who like to trade quickly or scalp. They support observing price fluctuations, as well as frequent ups and downs, allowing traders to execute a large number of orders quickly.
Large timeframes: Large timeframes like H1 or H4 are suitable for identifying the overall trend of the market. They help traders evaluate price movements over a long period of time, thereby planning long-term trading and making more accurate investment decisions.
Step 5: Opening and closing positions
Once the trader has assessed the trend and predicted strong fluctuations from the market. Next, it is necessary to determine the appropriate time to open and close orders, in order to optimize profits and limit risks in the market.
Buy when “Boom” appears
Assessing the current strength and state of the market: Traders should look for signals such as price breaking out of an accumulation zone or a steady uptrend. At the same time, combine analysis of technical indicators, such as increasing trading volume or trend-following candlestick patterns, to confirm market strength.
Confirming the bullish trend signal: When trading during a Boom phase, test your decision with multiple technical tools to ensure that the signals support the bullish trend. At the same time, consider the fundamental factors that can reinforce the positive market sentiment, helping to reduce risk and increase the reliability of the order.
Risk Management: Risk management is key when trading Boom and Crash. Therefore, you should pre-determine your entry and exit points to help control your losses. At the same time, apply stop-loss orders to protect your account from sudden fluctuations or sharp market reversals.
Sell when a “Crash” occurs
Identifying a weak market: Traders can look for signs that the market is weak, such as prices breaking through key support levels or maintaining a continuous downtrend. Combine technical analysis, such as increased trading volume or bearish candlestick patterns, to confirm a lack of market strength.
Confirm the bearish signal: Confirm the signal by using multiple technical indicators, ensuring that the signs share a bearish trend. At the same time, consider fundamental factors that may negatively impact market sentiment to reduce the risk of trading decisions.
Keep an eye on events and news: Always keep an eye on economic news and events that could put pressure on the market. Be prepared for sudden changes in sentiment, as they could cause sharp declines and have a strong impact on the direction of the Crash Index.
Effective investment strategy with Boom and crash index
There is no one-size-fits-all strategy for trading Boom and Crash indices. Each trader develops their own approach based on their trading style and risk tolerance. Here are some common strategies that traders use to take advantage of the volatility of these indices.
Effective investment strategy with Boom and crash index
Strategy Scalping
Scalping is a speculative strategy used by many traders on the Boom and crash Index. This method focuses on taking advantage of small price fluctuations in a short period of time, aiming to make quick and continuous profits without having to hold orders for a long time in the market.
With the Boom indicator, look for steady price increases. Traders should enter long positions when the uptrend is clear and take profits when the price starts to reverse after a sudden strong increase.
With the Crash indicator, look for consecutive price declines. Traders should open short positions on a downtrend and buy back when the price bounces back after a sudden sharp decline.
Strategy Breakout
Breakout strategies focus on waiting for prices to break through key support or resistance levels. When a breakout occurs, it is often accompanied by high volatility, giving traders the opportunity to enter positions in the direction of the new trend and capitalize on significant price movements.
With the Boom indicator, wait for the price to break an important resistance level and watch for a possible strong increase. This is a signal for traders to prepare to enter orders following the uptrend.
With the Crash indicator, watch for price to break a key support level and watch for a possible bounce. This is an opportunity for traders to prepare to open a buy order.
Trend Reversal Strategy
Reversal strategies focus on identifying the current trend and finding entry points when the market is about to change direction. This method requires careful observation of technical signals, understanding momentum and reacting quickly to price movements to effectively take advantage of reversal opportunities.
With the Boom indicator, traders can open sell orders when the price hits a resistance level and starts to reverse downwards after a sudden sharp increase, taking advantage of short-term price fluctuations.
With the Crash indicator, you can open a buy order when the price hits a support level and starts to bounce after a sharp decline. This strategy increases the possibility of profiting from a price reversal.
Mean Reversion
The retracement to the mean strategy is based on the principle that prices will eventually revert to their mean after sharp moves. Traders watch for extreme price phases, such as rapid bursts or crashes, and enter trades in anticipation of a price reversion to the mean. This method requires patience and timing, but if executed correctly, it can generate high returns even in highly volatile markets.
Advantages and disadvantages of using Boom & Crash strategy
Boom and crash strategy has the advantage of taking advantage of strong price fluctuations, helping traders make quick profits. However, it also has high risks, requires careful capital management and quick reactions to sudden increases or decreases.
Advantages and disadvantages of using Boom & Crash strategy
Advantage
High profitability: The high volatility of Boom and Crash creates high profit opportunities for traders. The rapid and unexpected price changes help to take advantage of strong moves, bringing high profit potential in a short period of time if caught at the right time.
Taking advantage of sudden price increases or decreases: This strategy helps traders take advantage of sudden price increases or decreases in the market. By identifying and trading at the right time during strong volatility phases, investors can maximize profits even in a short period of time.
Fast capital recovery: Thanks to the short time frames characteristic of Boom and Crash, traders have the opportunity to profit quickly. High trading speed helps optimize capital usage, taking advantage of short-term fluctuations to create timely and effective profits in a short period of time.
Disadvantages
Risk of Loss of capital: While the high volatility of Boom and Crash markets can create opportunities for high profits, it also carries the risk of losing capital. Rapid movements can bring high profits, but without careful risk management, traders can suffer rapid and heavy losses.
Unstable price movements: Boom and crash high volatility causes prices to change rapidly. This instability makes market behavior unpredictable and increases the risk of losses if trading decisions are not made carefully.
Difficult for beginner traders: The characteristics of boom and crash, such as fast movement speed and large amplitude, can be difficult for inexperienced traders. Analyzing, predicting and making accurate decisions require skills, knowledge and experience that often take time for beginners to accumulate.
Conclude
Trading on Boom and crash Index offers a unique experience with fast and sharp price movements. Despite the attractive profit potential, the market also carries high risks. To be successful, traders need analytical skills, strict discipline and effective risk management strategies to take advantage of profitable opportunities in a constantly changing environment.