
Algorithmic trading basics are crucial for traders to understand how computers automatically execute orders based on pre-programmed rules. Instead of relying solely on human emotion, algorithmic trading leverages data, processing speed, and mathematical logic to optimize trading decisions. Mastering these fundamental principles allows traders to approach the modern market more effectively and systematically.
- FOMO trading meaning explained for beginners chasing fast price moves
- Revenge trading and why losses trigger emotional trading behavior
What is algorithmic trading?
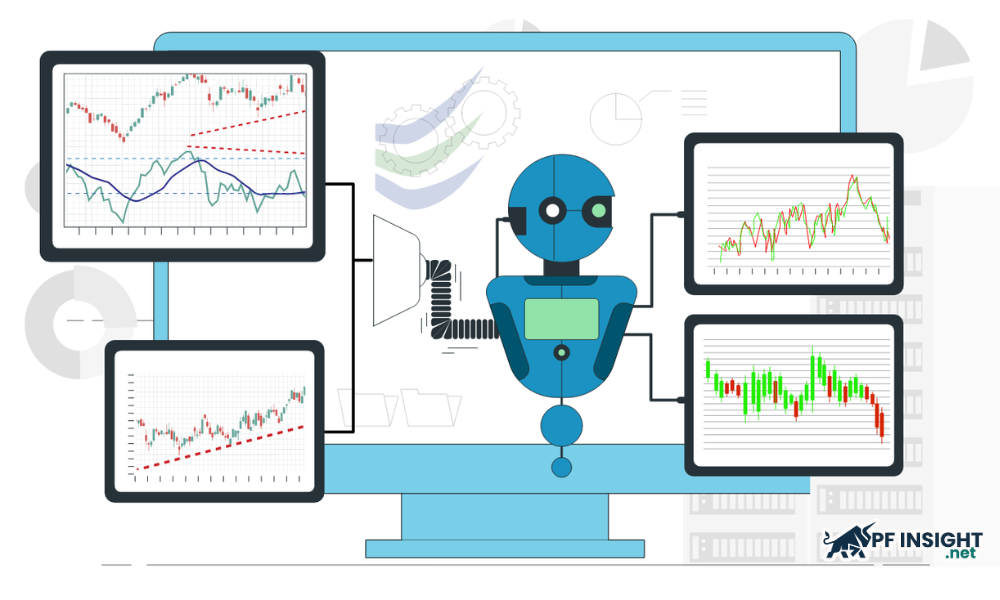
Algorithmic trading, also known as automated trading or algorithmic trading, is a method that uses computer software to execute orders based on pre-programmed rules. Instead of manual intervention, the system automatically analyzes and makes trading decisions. Thanks to its superior processing speed, this method has the potential to generate profits more frequently than traditional human trading.
Algorithmic trading basics explain how time-based, price-based, or mathematically-based trading systems automatically execute trades. Beyond profitability, this method improves market liquidity and systematic trading, while minimizing the influence of human emotions.
Why algorithmic trading offers an edge to investors?
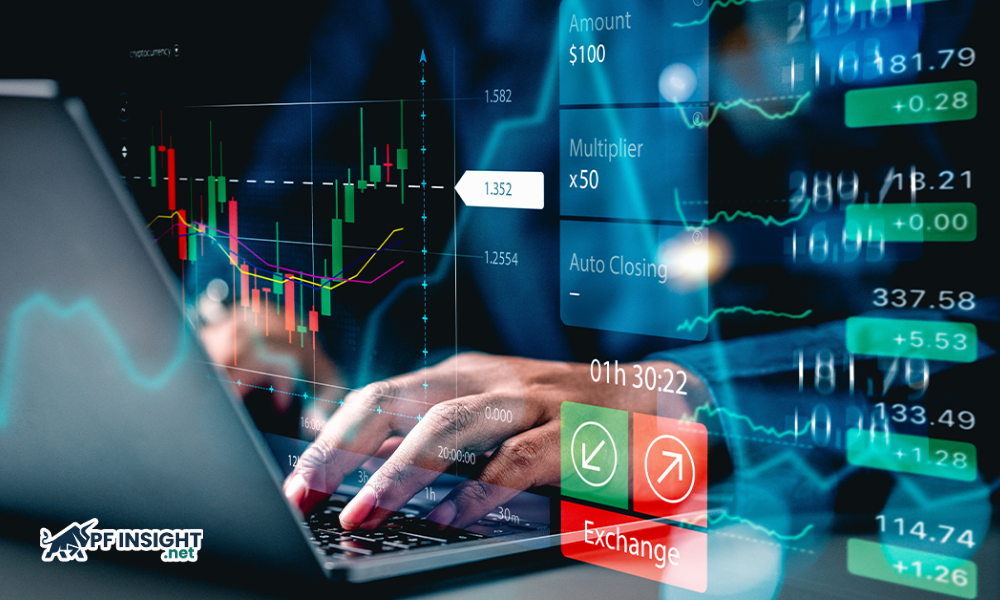
Algorithmic trading basics demonstrate that algorithmic trading is not simply a short-term trend. This method equips traders with automated tools to control risk, minimize losses, and optimize market entry time. As a result, trading becomes more disciplined and efficient, with many noteworthy practical benefits.
- Optimizing transaction costs: Every transaction incurs costs, and when accumulated over time, these can significantly erode profits. Algorithmic trading focuses on efficiency, executing only necessary orders to maximize net profit.
- Minimizing human error: By automating the order placement process, algorithmic trading minimizes errors arising from manual operations. Simultaneously, eliminating emotional factors helps traders maintain logical thinking, discipline, and consistent adherence to their strategies.
- Enhanced execution efficiency: Thanks to its ability to process multiple market conditions simultaneously, algorithmic trading allows orders to be executed at high speed and with superior accuracy. Low latency reduces the impact of price volatility, resulting in orders often being matched at or very close to the expected price.
- Strategy Backtesting: Algorithmic trading strategies can be easily tested using historical price data or real-time data. This process provides crucial information for evaluating the effectiveness and feasibility of the strategy before applying it to the real market.
Top indicators for algorithmic trading strategies
In algorithmic trading, traders often combine various indicators to assess price behavior and market context. Analyzing trends, chart patterns, and technical indicators plays a crucial role in identifying potential opportunities. These tools create a clear frame of reference, helping the algorithm make more accurate and consistent trading decisions.
Moving average (MA)
Moving averages reflect the average price of an asset over a given period, helping to smooth out volatility and highlight the main trend. This tool is commonly used to identify market direction, with two common forms being the simple moving average (SMA) and the exponential moving average (EMA).
Algorithmic trading basics emphasizes the role of SMA and EMA in trend analysis. SMA reflects the average price over time, while EMA reacts more quickly to new fluctuations. Based on the crossover between short-term and long-term moving averages, automated trading systems can consistently identify entry and exit points.
Relative Strength Index (RSI)
The RSI is an oscillator used to assess momentum by measuring the speed and magnitude of price fluctuations. This indicator oscillates between 0 and 100, with readings above 70 generally indicating overbought conditions, and readings below 30 reflecting oversold market conditions.
By analyzing the RSI, traders can assess the likelihood of a reversal and the sustainability of a trend. This makes RSI a popular tool in trend-following trading, supply and demand analysis, and effectively measuring market sentiment.
Bollinger Bands
Bollinger Bands consist of a central SMA line and two boundary bands that represent price fluctuations. Widening of the bands signals increased volatility, while narrowing indicates a period of low volatility or consolidation in the market.
According to algorithmic trading basics, Bollinger Bands support the development of automated trading strategies based on price fluctuations. Traders often use this indicator to buy when the price breaks above the upper band and sell when the price falls below the lower band in specific scenarios.
Stochastic Oscillator
The Stochastic Oscillator is a popular momentum indicator that helps traders assess the position of the closing price relative to high and low price ranges over a given period. With a scale from 0 to 100, this indicator provides overbought signals when it exceeds 80 and oversold signals when it falls below 20, aiding in the identification of potential market reversals.
Stochastic oscillators are commonly used to identify potential reversal points and assess the strength of the current trend, thereby assisting traders in making informed decisions.
Moving Average Convergence Divergence (MACD)
MACD is a trend-momentum indicator that reflects the relationship between two moving averages of price. This indicator is formed by subtracting the 26-period moving average from the 12-period moving average, thereby creating the MACD line used to analyze market signals.
Algorithmic trading basics show that using MACD along with the EMA 9 signal line helps algorithmic trading systems detect buy or sell opportunities based on changes in momentum.
Average true range (ATR)
ATR is an indicator used to assess market volatility by measuring the range of price fluctuations over a given period. This indicator is calculated by taking the average of the actual range, helping traders evaluate the real volatility of an asset.
In algorithmic trading basics, ATR is commonly used to set stop-loss levels and adjust position sizes to match market volatility.
On-balance volume (OBV)
The OBV indicator reflects the relationship between trading volume and price direction. By accumulating volume during upward price movements and eliminating volume during downward price movements, OBV helps form volume trend lines. This tool assists in identifying buying and selling pressure and confirming price trends.
By comparing price fluctuations with the OBV indicator, traders can identify market sentiment and detect signals confirming an uptrend or downtrend.
Fibonacci retracements
Fibonacci Retracement is an analytical tool that displays key price levels as horizontal lines. These levels reflect ratios in the Fibonacci sequence, including 23.6%, 38.2%, 61.8%, and 78.6%, and are often used to identify support and resistance zones in a trend.
Algorithmic trading basics show retracement levels that help automated trading systems identify entry and exit points and potential price reversals.
Ichimoku Cloud
The Ichimoku Cloud indicator is designed to help traders assess market conditions on a single chart. Developed and perfected over 30 years by Goichi Hosoda, this indicator was launched in the late 1960s. Ichimoku consists of five constituent lines, reflecting 9-period, 26-period, and 52-period moving averages, and combinations of these periods, thereby assisting in identifying trends, momentum, and key support and resistance zones.
Ichimoku Cloud helps traders identify trend direction, predict potential reversal points, and detect breakout opportunities in the market.
Parabolic SAR
The parabolic SAR indicator is used to track trends and identify reversal points. The indicator’s dots will appear above or below the price, reflecting an upward or downward market trend.
In algorithmic trading basics, parabolic SAR is often used to automatically place stop-loss orders and detect trend reversal signals.
Which technical conditions are needed for algorithmic trading?
Implementing algorithmic trading requires a combination of software tools and expertise in price data, technical indicators, and risk management. While high-end equipment isn’t necessary, fundamental technical skills are still essential.
- High-speed, low-latency infrastructure: Algorithmic trading basics show that the speed and stability of the network connection play a crucial role in algorithmic trading. To ensure orders are sent and executed on time, traders need a minimum connection speed of 100 Mbps. Using a wired Ethernet connection is recommended over Wi-Fi, as it offers greater stability and security.
- High-performance and scalable software platform: Choosing the right algorithmic trading platform plays a crucial role in a trader’s development. A suitable platform not only meets current needs but also supports future expansion, making it easy to build and optimize strategies as your skills and experience improve.
- Consistent and dependable market data feeds: Algorithmic trading basics shows that reliable market data plays a central role in automated trading systems. In a constantly fluctuating price environment, real-time data feeds help ensure accurate and up-to-date information. This allows traders to improve their analytical skills, optimize processes, reduce unnecessary costs, and increase decision-making speed.
- Proficiency in programming languages: The majority of algorithmic traders possess some programming background. Languages like Java and C++ are commonly used due to their speed and high performance. However, Python is preferred because it is open source, has an accessible syntax, and is particularly powerful in processing and analyzing market data.
Note: Many automated trading systems now allow traders to import libraries such as Pandas and NumPy to develop algorithms and test strategy effectiveness. In addition, some platforms offer more intuitive solutions, allowing users to leverage charting software like TradingView or drag-and-drop tools that don’t require programming to build strategies.
How to minimize risks in algorithmic trading systems

Understanding potential risks and proactively implementing control measures is key to safe trading. Here are some helpful suggestions.
- Leverage out-of-sample validation to reduce overfitting: Instead of relying solely on historical data for optimization, dedicate a portion of previously unused data to evaluating the strategy. This approach helps test the sustainability and profitability of the strategy in a real-world trading environment.
- Leverage diverse data feeds: Relying solely on one data provider can create bias in your strategy. To mitigate this risk, combine data from multiple sources to validate hypotheses and ensure your strategy is tested under various market conditions.
- Update and refine your trading strategy regularly: The market is constantly changing, so the strategy you’re using may become ineffective over time. Regularly reviewing and updating your strategy ensures it remains relevant to new conditions and optimizes profitability.
- Set realistic performance goals: No strategy can consistently win in all market conditions. Even the best strategies will experience periods of losses. Set realistic expectations, focus on long-term profits, and be prepared to adjust as the market changes.
Conclude
Understanding and applying algorithmic trading basics is a crucial first step in building a successful automated trading system. According to PF Insight, from software selection and market data to risk management and strategy testing, these fundamental principles help traders operate effectively, minimize risk, and maintain sustainable profits over time.


