
In trading, a trend continuation strategy focuses on capitalizing on market momentum by following established trends rather than attempting to predict reversals. In strong trending conditions, price often pauses briefly through consolidation before resuming its original direction. Understanding how this strategy works allows traders to identify higher-probability entries while managing risk more effectively. According to insights from PF Insight, combining price patterns, confirmation tools, and disciplined risk management is essential for successfully trading trend continuations.
- Forward testing trading and why it matters after backtesting results
- Backtesting trading strategies and how traders evaluate historical performance
- Trading discipline tips to stay consistent over time
What is a trend continuation strategy?
A trend continuation strategy is a trading approach designed to enter positions after a temporary pause within an existing trend. Instead of trying to catch tops or bottoms, traders wait for consolidation phases where price gathers liquidity before continuing in the dominant direction. This works because financial markets are driven by institutional flow. Large players rarely enter in one move; they scale positions during pullbacks and sideways structures, creating continuation setups that retail traders can follow.
In simple terms: Strong trend → short consolidation → breakout → trend resumes
Why trends pause before continuing
Trends do not move in straight lines. They pause for two main reasons:
- Market consolidation and profit-taking: After strong impulsive moves, short-term traders take profits while new participants wait for better entries. This creates sideways price action without breaking the overall trend structure.
- Liquidity buildup before breakout: During consolidation, buy and sell orders accumulate around support and resistance zones. Once liquidity is sufficient, price often breaks out with momentum, continuing the dominant trend. These pauses form the basis of continuation patterns.
Key trend continuation patterns traders use
Certain price formations consistently appear during trending markets and signal potential continuation.
Flags
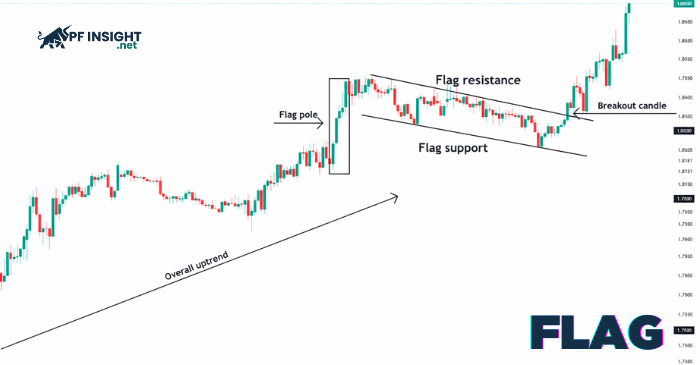
Flags form when price consolidates in parallel channels after a strong impulse. They reflect controlled pullbacks before momentum resumes.
Trading implication: breakouts from flags often lead to fast continuation moves.
Pennants
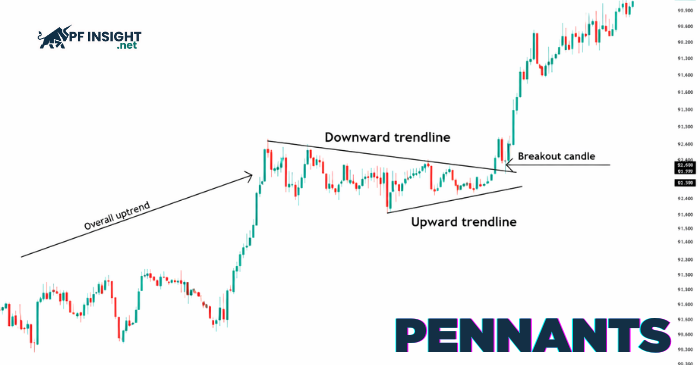
Pennants resemble small symmetrical triangles that form after sharp price movements. Volatility compresses before expansion.
Trading implication: momentum frequently returns once price breaks the structure.
Symmetrical triangles
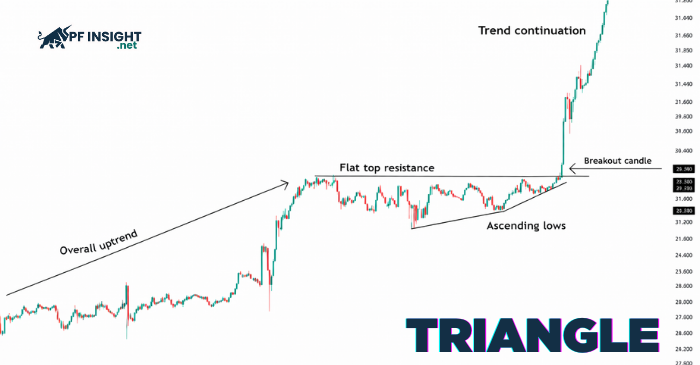
These form through converging trendlines during consolidation phases.
Trading implication: breakouts in the trend direction usually signal continuation.
Rectangles
Rectangles appear as horizontal ranges where price repeatedly tests support and resistance.
Trading implication: breakouts from the range often lead to trend resumption.
How traders confirm strong trends
Patterns alone are not enough. Professional traders use confirmation tools to filter false breakouts.
Moving averages for trend direction
Common trend filters include
- 200-day moving average for long-term trend
- 50-day moving average for medium-term structure
- 10- or 20-day moving average for momentum timing
When price remains above key averages in an uptrend (or below in a downtrend), continuation setups carry higher probability.
As legendary trader Marty Schwartz famously explained, staying on the correct side of the moving average dramatically improves trading consistency.
Volume behavior in trend continuation
Volume validates breakout strength. Strong continuation moves usually show:
- Increased volume on breakouts
- Stable volume during consolidation
- Rising volume in trend direction
Weak volume often signals false moves.
Momentum indicators
Tools such as RSI and MACD help confirm:
- Trend strength
- Momentum alignment
- Divergences that warn of weakening moves
When momentum supports the breakout, continuation trades become more reliable.
How to trade trend continuations step by step
1. Identify the dominant trend: Use higher timeframes and moving averages to confirm clear direction.
2. Wait for consolidation patterns: Look for flags, pennants, triangles, or rectangles forming within the trend.
3. Enter on breakout confirmation
Ideal entries occur when:
- Price breaks structure in trend direction
- Volume expands
- Momentum aligns
4. Place stop losses logically
Common stop placements:
- The below pattern supports uptrends.
- Above resistance in downtrends
This protects capital if the breakout fails.
5. Set profit targets or trail stops
Methods include:
- Measuring pattern height
- Using previous swing levels
- Trailing stops with ATR or moving averages
Risk management in strong trending markets
Even high-probability setups fail. Risk control keeps traders profitable long-term. Key principles:
- Risk 1% or less per trade
- Use fixed stop-loss orders
- Adjust position size to volatility
- Move stops to break even when appropriate
- Set daily loss limits
Common mistakes in trend continuation trading
Confusing consolidation with reversal
Sideways price action within strong trends is a natural part of market structure, not a signal that the trend has ended. Many traders panic when momentum slows and exit positions prematurely, only to watch the price break out in the original direction moments later. Consolidation phases allow liquidity to build and weak hands to exit before continuation moves accelerate. Learning to distinguish healthy pullbacks from genuine trend reversals is critical for staying in high-probability trades longer.
Trading every breakout
Not every breakout leads to a sustainable continuation move. Weak breakouts often occur with low volume, poor momentum alignment, or against higher-timeframe structure. Entering every breakout without confirmation exposes traders to frequent false signals and unnecessary losses. High-probability continuation trades usually show clear structure breaks supported by rising volume and strong trend context.
Ignoring key price levels
Major support and resistance zones such as previous highs, lows, consolidation ranges, and high-volume areas play a significant role in breakout success. Breakouts that occur directly into strong resistance often fail or retrace sharply. Professional traders map these levels in advance and wait for clean breaks or retests before entering. Respecting key levels improves entry precision and risk-to-reward ratios.
Overtrading
Overtrading is one of the fastest ways to erode a profitable strategy. Taking too many low-quality setups increases transaction costs, emotional fatigue, and drawdowns. Strong trend continuation trading focuses on a small number of high-confidence opportunities aligned with market structure and momentum. Limiting trades to the best setups preserves capital and improves long-term consistency.
Conclusion
By applying a trend continuation strategy with clear structure, confirmation signals, and disciplined risk control, traders can align themselves with the market’s strongest momentum phases. Continuation patterns combined with volume and trend filters help filter out low-probability setups and reduce emotional decision-making. Consistency comes from executing the same high-quality setups rather than chasing every price movement. Over time, this approach builds a stable trading edge across different market conditions. Wishing you disciplined execution and continued success in your trading journey.


