
Liquidity sweep trading is not a mechanical entry strategy, but a way to read market intent through liquidity. When price quickly breaks above a recent high or below a recent low and then sharply reverses, it often signals a liquidity sweep. Understanding this behavior helps traders avoid FOMO, improve entry timing, and trade in alignment with smart money rather than following the crowd. In this article, pfinsight.net will guide you on how to identify and apply liquidity sweep concepts effectively.
- Change of character trading (CHOCH): what it is and how it differs from BOS
- Break of structure trading and how it differs from simple breakout setups
- Smart Money Concepts: Understanding how institutional trading moves prices
What is liquidity sweep?
A liquidity sweep is considered a deliberate market action where large amounts of money drive prices towards areas with high liquidity. These are often locations densely packed with stop-loss orders, pending orders, or breakout points that are closely watched by many people.
When these orders are triggered, liquidity surges, enabling large institutions to efficiently match large transaction volumes while minimizing slippage costs.
Different types of liquidity sweep trading
In liquidity sweep trading, the market primarily operates on two types of liquidity: buy-side liquidity and sell-side liquidity. Clearly distinguishing between these two types helps traders accurately understand the direction of the sweep and the price intent.
Buy side liquidity sweep
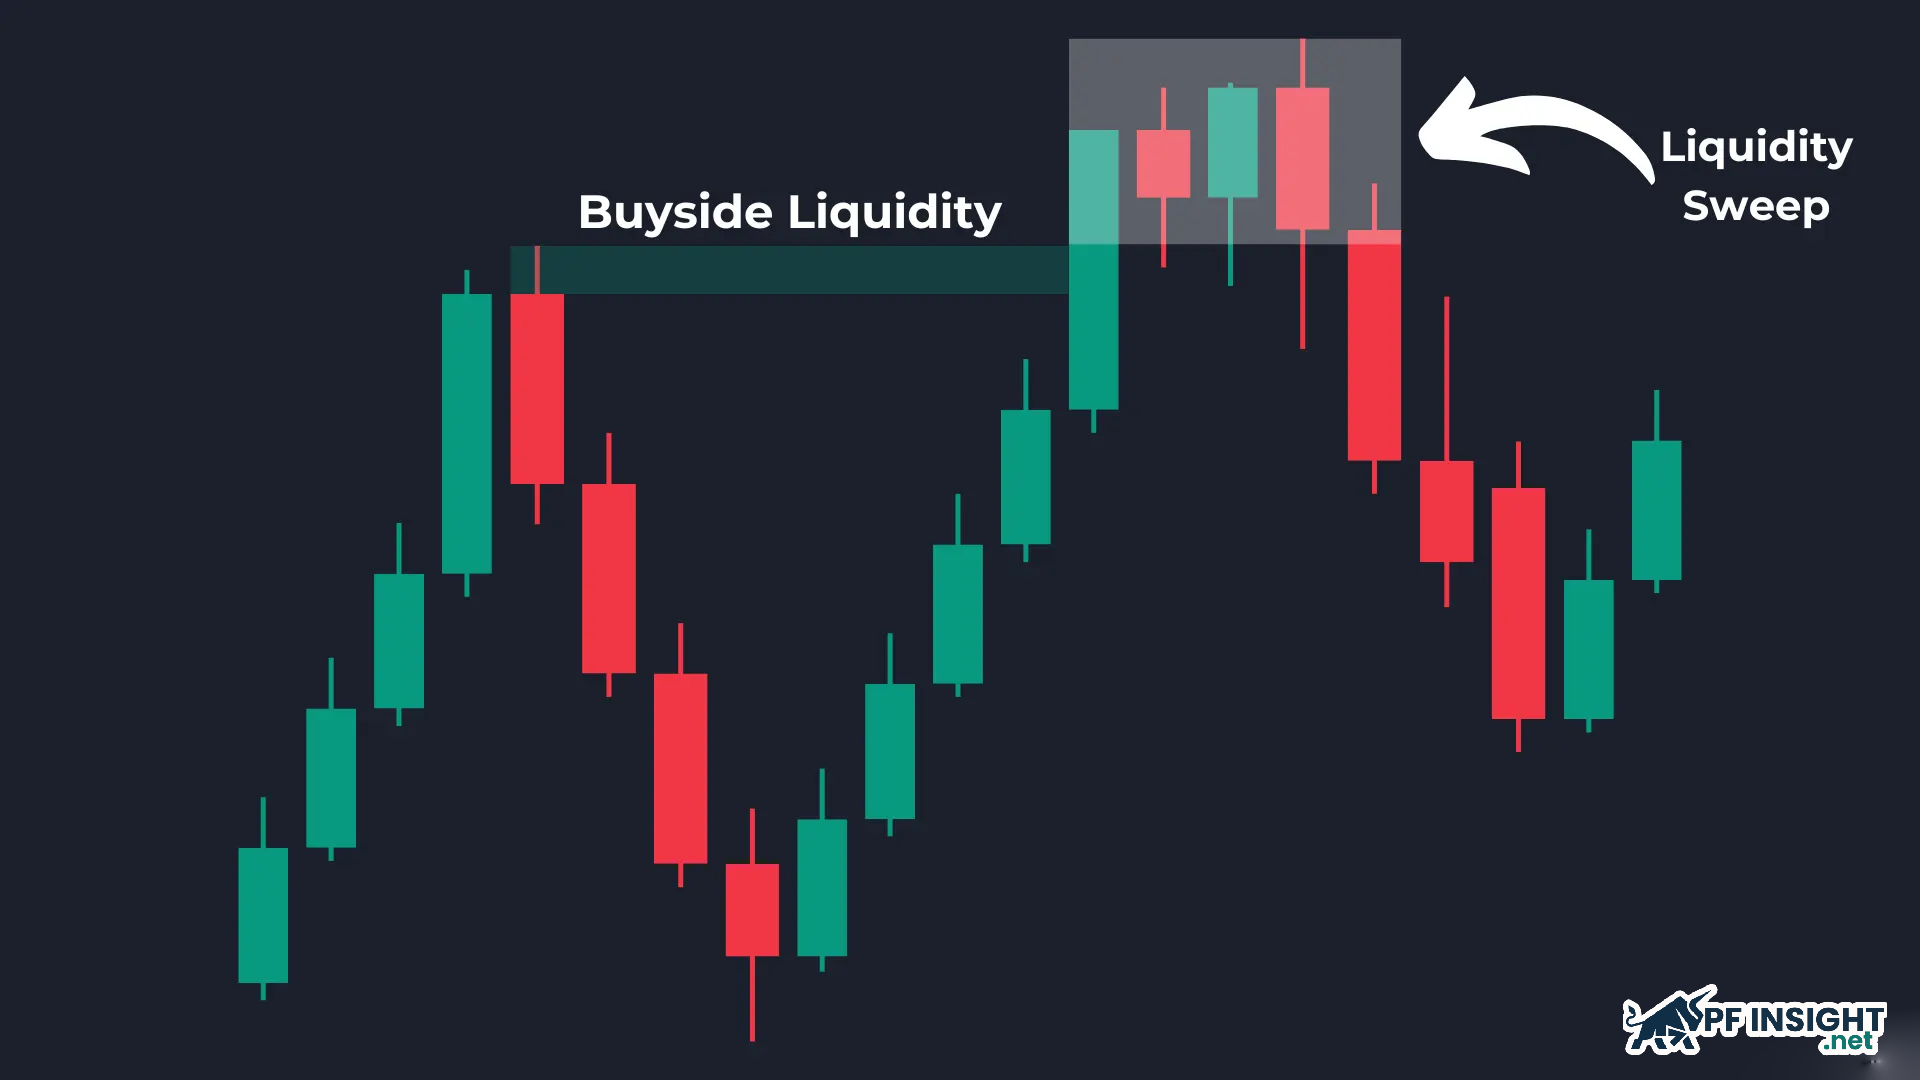
A buy-side liquidity sweep occurs when the market breaks through key highs, attracting a large influx of buy orders. Stop-buy orders and breakout buy orders are triggered, allowing large sellers to execute significant trades without causing sharp slippage. Following this process, the price typically weakens or reverses as the buying pressure is essentially absorbed.
Key characteristics of a buy-side liquidity sweep:
- This usually occurs when the price breaks above a resistance zone or previous highs.
- Prices surged sharply in a short period, forming a clear bullish candlestick, then quickly reversed and fell.
- This process triggers a series of buy orders following the breakout trend from retail traders.
- The result is a liquidity trap, after which the market enters a correction phase or a sharp decline.
Sell side liquidity sweep
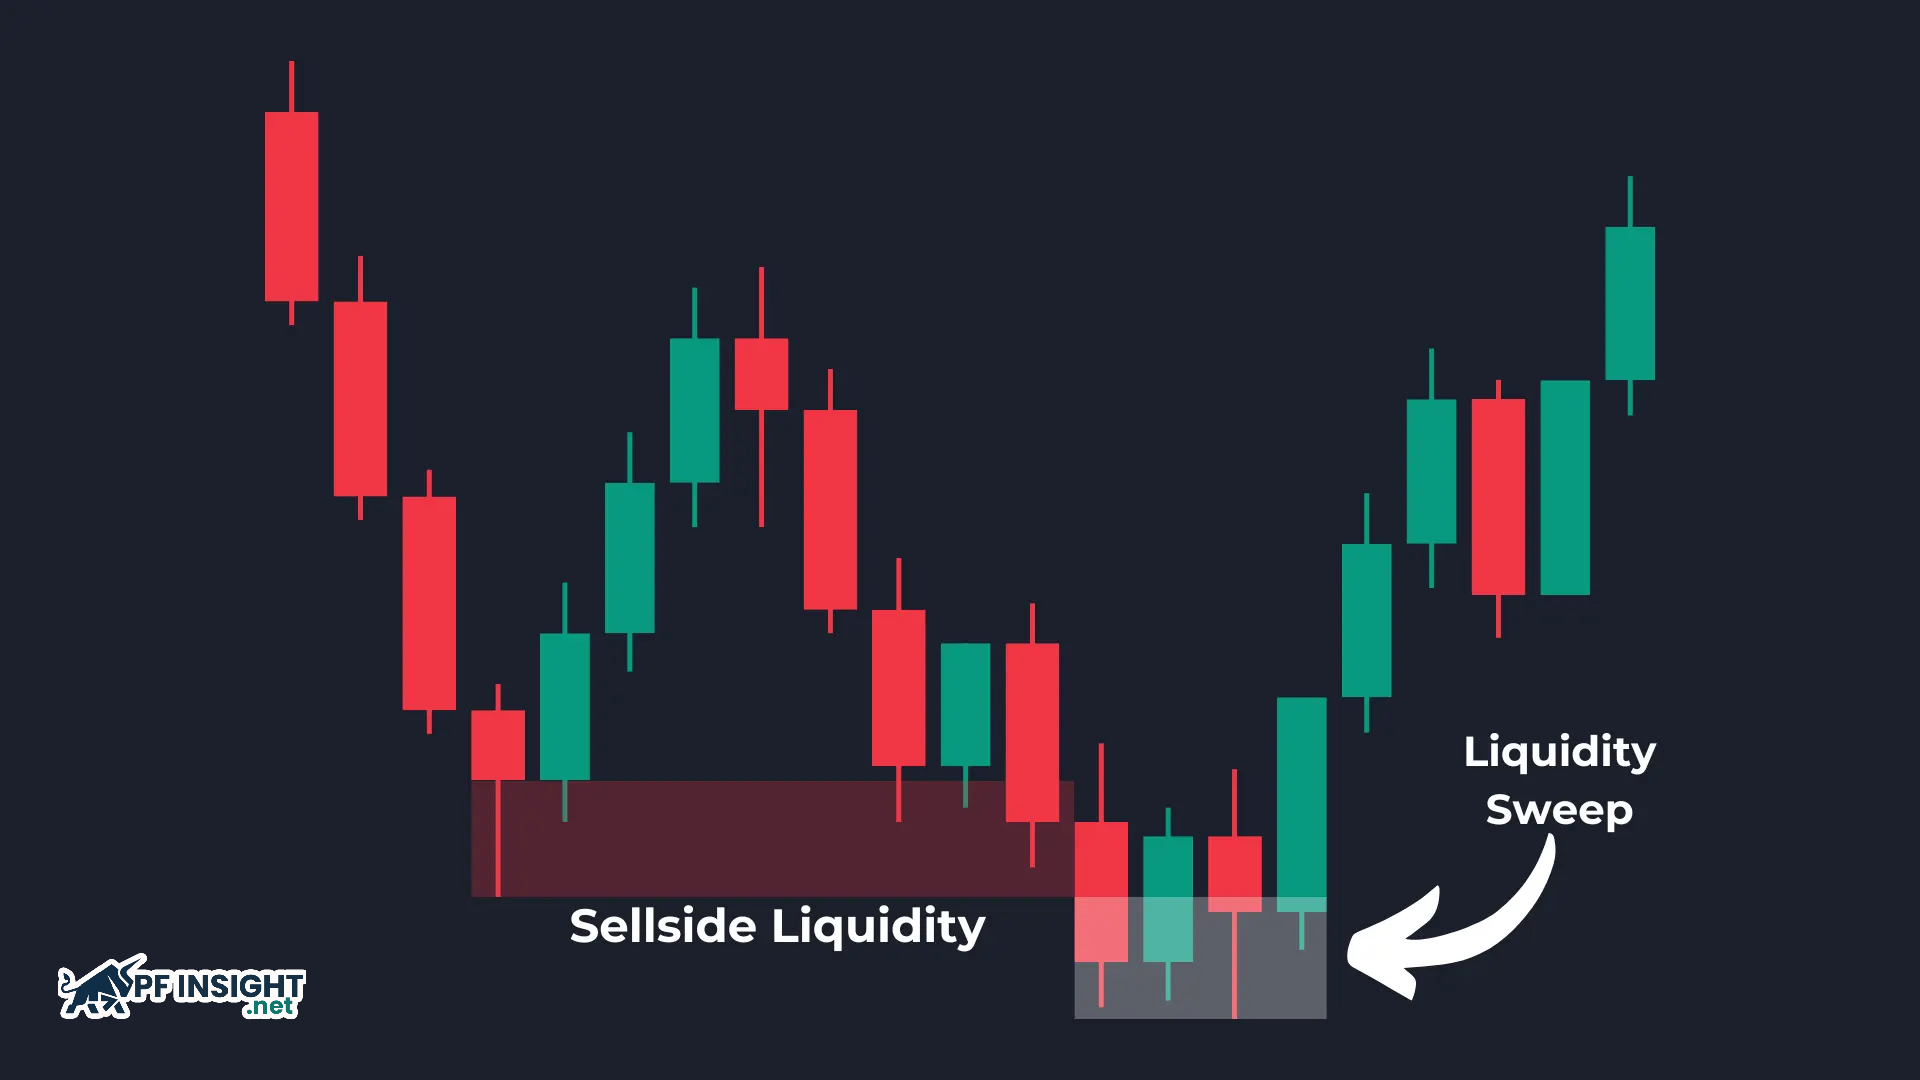
A sell-side liquidity sweep typically occurs when the price is pushed below the nearest lows or key support zones. This move triggers a surge in stop-loss orders for buy positions and sell orders following the bearish breakout. The sudden increase in sell orders creates abundant liquidity, allowing large institutions to quietly buy at better prices, preparing for a recovery or upward reversal.
Key characteristics of sell-side liquidity sweep:
- This formation typically occurs when the price breaks through a support zone or the low of the previous session.
- Prices plummeted rapidly in a short period, then rebounded strongly.
- Retail traders are easily drawn into short selling orders right before a reversal.
- This volatility helps the market eliminate weak positions before entering the next upward trend.
How liquidity sweeps are created in trading?
Liquidity sweep trading typically follows a clear five-step sequence, reflecting how the market seeks and exploits liquidity. Correctly identifying each stage allows traders to be more proactive in choosing entry points with a high probability of success.

Stage 1: Market in an accumulation phase
During the accumulation phase, the market maintains equilibrium around a key price level, creating a pattern of equal tops or equal bottoms. These areas often attract stop-loss orders from traders following popular strategies. The accumulation process can last from a few hours to several days, and the longer the accumulation period, the thicker the liquidity outside the price range, creating conditions for the next phase of volatility.
Stage 2: Preparation for the liquidity sweep
The repeated failure of the price to break through a key level leads many traders to believe that this area is strong enough to trade on price reaction. Each time it is rejected, more and more stop-loss orders are placed just above the threshold. In liquidity sweep trading, market makers monitor this process to identify the ideal area of concentrated liquidity. The order flow often shows a sharp increase in trading activity around the key price level.
Stage 3: Liquidity sweep execution
During the peak of a liquidity sweep, the price surges through technical resistance levels, triggering a sharp increase in volume. Stop-loss and breakout orders are simultaneously triggered, creating immediate buying pressure. Trend-following traders quickly jump in, hoping to catch the new wave. In reality, this phase is short-lived and often acts as a false breakout designed to attract liquidity.
Stage 4: Trend reversal
After a sweep, the price often reverses very quickly within just a few candles, returning to the inside of the previous resistance zone. Long wicks begin to appear on the chart, indicating clear price rejection. A strong reversal candle serves as confirmation of a liquidity trap. Trading volume usually increases again as institutions deploy their prepared positions, while traders trapped in positions hastily exit.
Stage 5: Trend continuation
In liquidity sweep trading, after the liquidity sweep is complete and the price clearly reverses, the market usually enters a strong upward movement in the intended direction. This momentum comes from traders being forced to close their positions due to being trapped, combined with large order flows from pre-planned institutions. Once the order book has been “cleaned up,” the price tends to move more smoothly, encountering less resistance and more easily forming a clear trend.
Signs of liquidity sweep trading

Recognizing liquidity sweep trading is crucial in helping traders avoid false breakouts and trade in line with large capital flows. Below are key signals indicating that the market is likely entering a liquidity sweep phase.
- Long wicks extending beyond technical levels: Candlesticks with long wicks that penetrate support or resistance levels often indicate strong price rejection. This is a sign that the market is exploiting stop-loss orders located around key levels.
- Anomalous volume surge: A sharp increase in volume during a breakout indicates that large amounts of money are triggering a series of pending buy or sell orders, rather than natural trading pressure.
- Short-term price reversal: When the price breaks through a technical threshold and then quickly reverses, it’s highly likely to be a liquidity sweep rather than a true breakout.
- Occurring during periods of low liquidity: Liquidity sweep trading typically takes place when the market has few traders, such as at the beginning of the session or during the Asian session, when the order book is thin and easily manipulated.
- No continuation after the breakout: A breakout of the session’s high/low but lacking a clear follow-through is a warning sign of a price trap, suggesting the market may be conducting a price sweep rather than forming a new trend.
Liquidity sweep trading requires traders to look not only at price patterns, but also to assess liquidity areas and volume volatility. When these factors align, traders can more accurately confirm the trend and avoid impulsive trades.
Comparing liquidity sweep and liquidity grab in trading
Although liquidity sweeps and liquidity grabs are often confused and used interchangeably, in reality, these two concepts have distinct differences in how the market operates. The following section will clarify the differences between these two phenomena in trading.
|
Features |
Liquidity sweep | Liquidity grab |
| Definition | A large-scale move, implemented to attract and exploit liquidity across multiple price ranges. |
A carefully calculated move to hit stop-loss points or create entry opportunities at specific price levels. |
|
Scope |
It relates to price fluctuations over a wide range, rather than being concentrated at a specific level. | They typically have a narrow range, focusing on a single price point. |
| Intent | The aim is to facilitate efficient order matching for institutions and to direct market cash flow in the short term. |
The aim is to trigger stop-loss orders and lure retail traders into unfavorable positions. |
|
Aftermath |
This could cause the market to reverse rapidly or continue in its current trend. |
It often ends with a reversal that deceives the market. |
In financial markets, these two behaviors are often employed by large institutions to attract and utilize liquidity from retail investors. For retail traders, understanding and clearly distinguishing between liquidity grabbing and clearing patterns helps limit losses due to noise signals. When combined with the right market context, these patterns can also provide high-probability entry points, instead of chasing unconfirmed breakouts.
Mastering liquidity sweep strategies in trading
Liquidity sweep trading exploits liquidity-sweeping behavior through false breakout signals, helping traders detect institutional intervention and avoid falling into common market psychological traps. Here are three steps to execute a trade during a liquidity sweep:

Step 1: Identify the liquidity accumulation phase
Before liquidity sweep trading occurs, the market often displays early warning signals that traders need to observe in order to prepare appropriate trading scenarios.
- Prices are consolidating and consolidating for an extended period around key support or resistance levels.
- Trading volume gradually weakened as prices approached key levels.
- The market has touched this price level several times but has failed to make a convincing breakout.
- The stop-loss placements of retail traders are clearly visible on the chart structure.
Step 2: Combine additional factors
Liquidity sweep trading doesn’t rely entirely on indicators, but they can help strengthen the reliability of a trading setup.
- Multi-timeframe analysis: By combining high and low timeframes, traders can identify key liquidity hotspots and optimize entry points. Liquidity sweeps should be considered within the context of the overall trend to avoid counter-trend trading.
- Volume analysis: In liquidity sweep trading, a sudden surge in volume is often accompanied by stop-loss order triggers. Comparing the volume structure before and after the sweep helps confirm the signal and optimize entry points.
- Confirming order volume: Monitoring order flow and DOM allows for an assessment of how the market handles large-volume orders. When the price doesn’t move significantly despite many orders being executed, it’s a sign of absorption and accumulation by institutional money.
Step 3: Identify entry and exit signals
Mastering entry and exit signals in liquidity sweep trading helps traders enter trades at the right time and avoid false breakouts.
Entry signals:
- Prices sweep up or down around key peaks/troughs – areas where liquidity is concentrated.
- A clear rejection signal, such as a pin bar, engulfing, or strong reversal candlestick, appears shortly afterward.
- The movement is reinforced by an increase in mass or a rapid retest phase of the area just scanned.
Exit signals:
- Prices are moving towards the next supply-demand zone in the market structure.
- Weakening signals appear, such as Doji candles, momentum divergence, or diminishing upward momentum.
- The stop loss is safely placed above/below the peak or bottom of the most recent price movement.
Common mistakes in liquidity sweep trading

Applying liquidity sweep trading effectively requires not only understanding the strategy but also avoiding common pitfalls. Below are serious mistakes that often lead traders to losses when trying to trade using this pattern.
- Entering trades too early: Many impatient traders try to catch the bottom or top as soon as the price shows signs of reversal. This approach often leads to repeated stop-loss hits. Remember that institutional money can push prices further than expected. Instead of guessing, patiently wait for a clear confirmation signal.
- Stop-loss orders placed too close: Placing stop-loss orders too close to the entry point makes the trade easily exited from the market due to short-term fluctuations. Institutions often create multiple liquidity sweeps to eliminate weak positions. Allow sufficient space for the stop-loss level, while still controlling risk with appropriate volume.
- Ignoring the market context: Not every breakout through support or resistance necessarily translates into a liquidity sweep. Traders need to place price movements within the overall picture, including the main trend, news factors, time of day, trading session, and recent price behavior to avoid misinterpreting signals.
- Overtrading: Understanding liquidity sweep trading doesn’t mean entering trades at every setup. Spreading your trades too thinly often leads to significant losses. Prioritize trades with clear structure, ample liquidity, and high probability, rather than chasing the number of trades.
Tips for trading using liquidity sweeps
To take full advantage of periods of high liquidity, traders should consider the following important trading principles.
- Always identify the main market trend before placing an order.
- Identify areas of concentrated liquidity such as price peaks, troughs, and accumulation zones.
- Wait for a clear rejection signal from a reversal candlestick such as a pin bar or engulfing.
- Combine trading volume and signal convergence to increase reliability.
- Place your stop loss outside the liquidity sweep zone to avoid early exit.
- Maintain discipline, avoid predicting events, and only react when there is confirmation.
Conclude
Liquidity sweep trading reflects how the market actually operates, where liquidity plays a central role. However, it’s not a get-rich-quick formula, but rather a skill that requires time and practice. By combining market structure analysis, volume analysis, and personal discipline, traders can leverage liquidity sweeps to reduce risk, increase their chances of winning, and trade more proactively.
: what it is and how it differs from BOS")


