The ADX indicator (Average Directional Index) is an important tool that helps traders measure the strength of a trend rather than simply identifying price direction. In a constantly fluctuating market, understanding whether a trend is strong or weak allows traders to avoid emotional entries. The ADX indicator is especially useful for filtering market noise, reducing trades during sideways conditions, and optimizing trend-following strategies more effectively.
The ADX indicator is a technical analysis tool used to measure the strength or weakness of a trend. This indicator doesn’t focus on the upward or downward direction, but rather reflects the trend’s intensity, helping traders identify whether the market is volatile or in a sideways trend.
The ADX indicator was developed by Welles Wilder – a renowned technical analyst in the financial markets. He also created many tools familiar to traders, such as RSI and Parabolic SAR, indicators used to identify trends and price momentum.
The operating principle of the Average Directional index
The operating principle of the Average Directional index
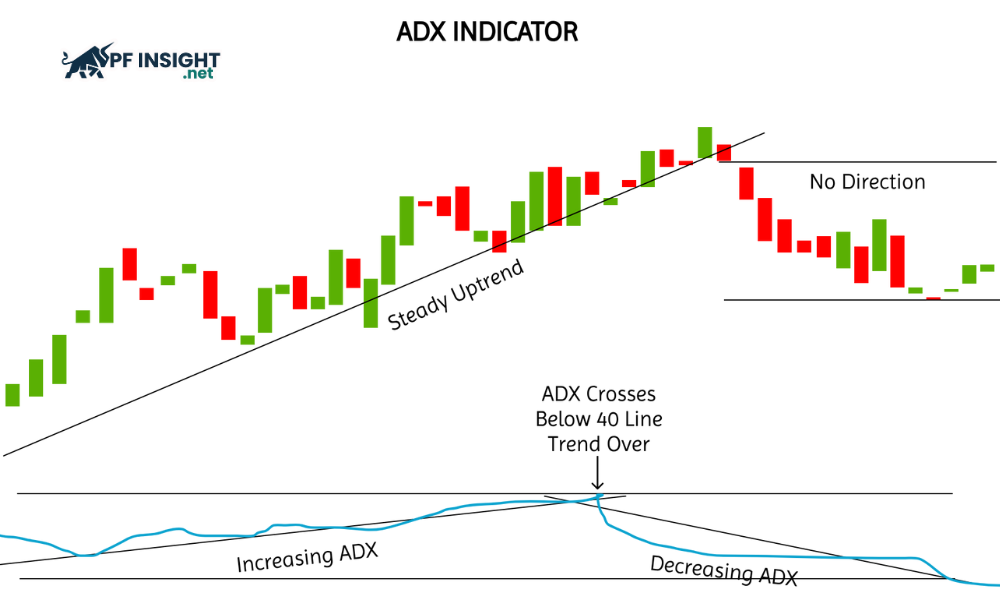
The ADX indicator typically appears as a single line below the main chart area. The ADX value ranges from 0 to 100, reflecting the strength of the trend rather than the direction of price movement.
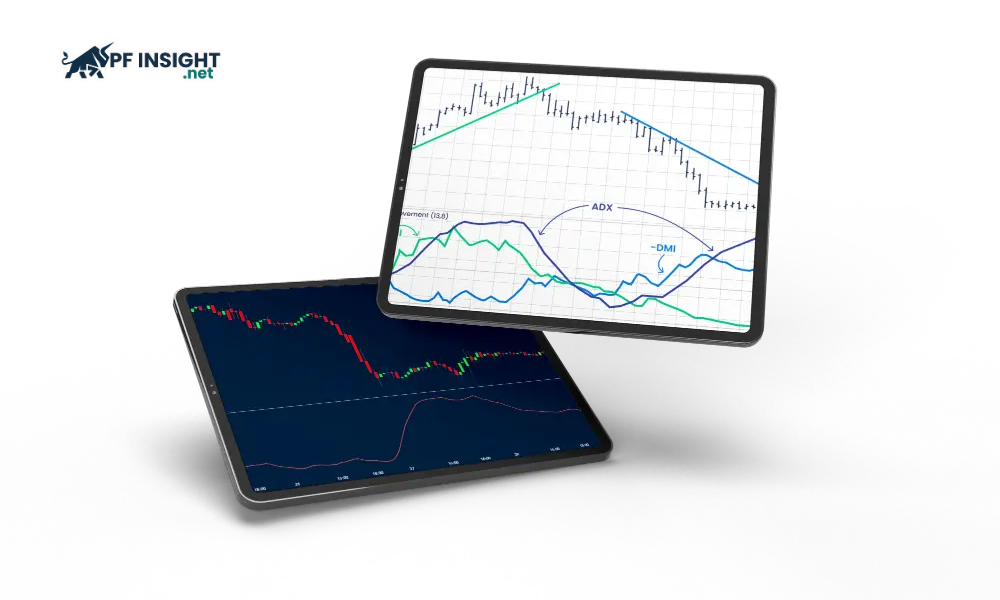
The Average Directional Index is calculated based on a combination of two indicators that move in opposite directions. Specifically:
The +DI (Positive Directional Indicator) reflects the strength of an uptrend, showing how dominant buying pressure is in the market.
The -DI (Negative Directional Indicator) represents the intensity of a downtrend, helping traders assess the strength of selling pressure during each phase.
The ADX line is calculated by averaging the difference between +DI and -DI and then smoothing it over a specified period, with 14 periods being the most commonly used setting.
ADX values are typically interpreted according to the following principles:
0–20: The market has little to no clear trend or a very weak trend; prices usually move sideways.
20–25: Signals a trend is beginning to form; when ADX rises above 20, the likelihood of a new trend emerging increases significantly.
25–50: Indicates that the current trend is strong and stable enough for traders to consider trading with the trend.
50–75: Indicates a very strong trend, high momentum, and clear price volatility.
75–100: Represents an extremely strong trend, often accompanied by drastic market fluctuations.
An increase in ADX indicates that the trend is strengthening, regardless of whether the price is moving up or down. When ADX decreases, the trend shows signs of weakening and the market may be consolidating. Therefore, ADX helps both confirm the trend and assist traders in avoiding trading in noisy markets.
A high ADX reading accompanied by an upward trend indicates a clear and strong market trend. Conversely, a low and downward ADX reading typically signals a sideways market, limiting the effectiveness of trend-following trading methods.
ADX calculation method
When trading on MT4 or MT5, the ADX indicator is already calculated and displayed automatically by the system. Traders only need to add the indicator to their chart to use it. However, understanding how ADX is generated will help you understand how the indicator reacts to market fluctuations.
The calculation process is carried out through several different steps:
The true range (TR) is determined by selecting the largest value from the following calculations:
The difference between the highest and lowest prices of the current period.
The absolute value of the current high compared to the previous closing price.
The absolute value of the current low compared to the previous closing price.
Directional Movement (DM):
+DM (Directional Movement Positive) is calculated as the difference between the current high and the previous high, and is only recognized when this value is positive and greater than the difference between the previous low and the current low.
-DM (Negative Directional Movement) is determined by the difference between the previous low and the current low, and is only applied when the result is positive and exceeds the difference between the current high and the previous high.
Note: If the above conditions are not met, the values of +DM and -DM will be calculated as 0.
The +DM, -DM, and TR values will be smoothed before use:
After being calculated, the values are further smoothed periodically, usually every 14 periods. The result of this step is the average true volatility range (ATR) along with two indicators, +DMI and -DMI, which help traders more accurately assess volatility and trends.
It is calculated by taking the absolute value of the difference between +DMI and -DMI, then dividing it by the sum of these two indicators and multiplying by 100 to normalize the result.
DX = ([+DM + −DM] / [+DMI − −DM]) x 100
Average Directional Index (ADX):
The ADX value represents the smoothed average of DX over a selected time period, most commonly 14 cycles. ADX is determined by simply averaging the first 14 DXs, then subsequent values are calculated using a smoothing formula to reduce market noise.
Current ADX = ([previous ADX X 13] + current DX) / 14.
How to read ADX signals for effective trading
When using the ADX indicator, traders need to understand how to interpret the indicator’s values to assess trend strength, in order to choose more appropriate and effective trading times.
How to read ADX signals for effective trading
Analyzing trend strength
ADX below 20–25: This reflects a lack of clear trend or sideways movement in the market. In this condition, trend-following trading strategies are generally less effective and should be used sparingly.
When the ADX rises above 25: This indicates a potential trend is forming or becoming stronger. Many traders view the 25 mark as a confirmation signal to begin implementing trend-following strategies.
ADX above 40: Indicates a strong and established trend. This is often a good opportunity for traders who prefer trend-following trading.
A decline in ADX after reaching a high indicates weakening trend momentum, suggesting the market may be entering a consolidation phase or potentially reversing.
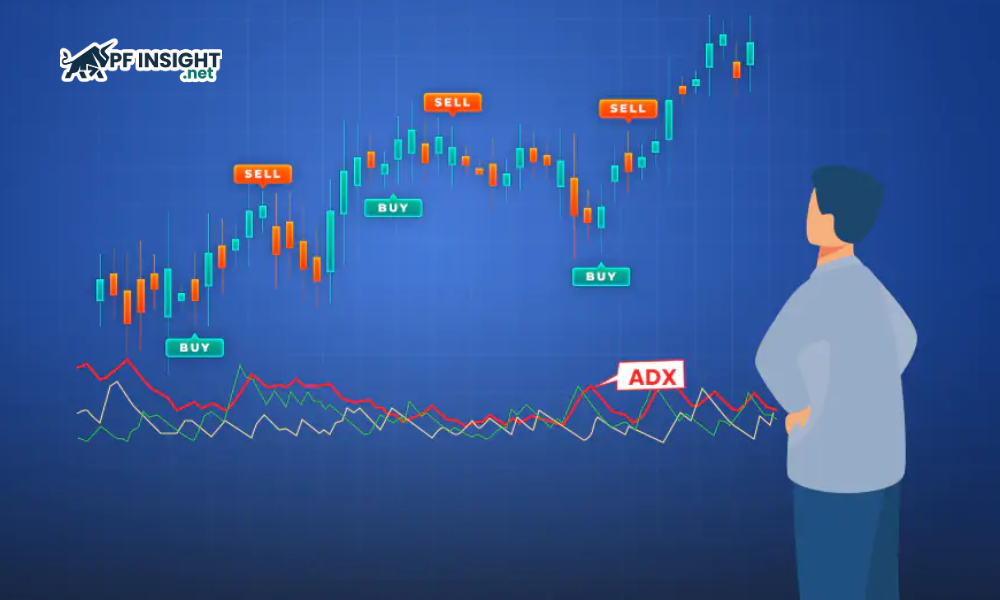
Trade entry and exit conditions
The ADX indicator isn’t intended to pinpoint exact entry or exit points, but it’s very useful in confirming those signals. When traders have used other tools to find trends and suitable trading points, ADX can act as a filter, increasing confidence before entering a trade.
For example, when the ADX crosses above 25, this can serve as confirmation for a breakout from a consolidation zone, giving traders more confidence to enter a trade. Conversely, if the ADX begins to decline after reaching a high, it could signal that the trend is losing momentum, making it appropriate to take profits or move the stop loss tighter.
Assessing trend strength and momentum changes
The ADX indicator helps traders identify whether the market is trending clearly or just fluctuating sideways. When ADX increases, it reflects strengthening trend momentum; conversely, a decrease in ADX indicates weakening market strength. This allows traders to flexibly adjust their trading strategies to suit each market phase.
When the ADX is high and continues to rise, it indicates that the trend is strong enough, making it a suitable choice for trend-following trading strategies.
Conversely, when the ADX is low and declining, the market often lacks a clear trend; traders should consider trading strategies within a narrow range or patiently wait until a new trend forms.
ADX crossovers and breakouts
Although ADX isn’t commonly used as a +DI and -DI crossover signal to determine trading direction, it still provides important context for breakout phases. When a breakout occurs simultaneously with ADX rising above 25, the signal’s reliability is usually higher. This reflects that the new trend isn’t just appearing randomly but is supported by genuine market strength.
Top trading strategies using the ADX indicator
The ADX indicator is often not as effective when used alone. Its true value is more apparent when combined with other technical tools or within specific trading systems. Below are some common strategies that apply ADX in practice.
Top trading strategies using the ADX indicator
ADX trading strategy with a 2-period setting
Instead of using the traditional 14-period ADX indicator, this strategy shortens the period to 2 to focus on short-term fluctuations. The 2-period ADX is capable of capturing signals very quickly, helping traders identify early bursts of momentum or signs of trend saturation.
Setup rule: Watch for when the 2-period ADX rises sharply to very high levels, such as above 60–70. This usually reflects extremely strong short-term momentum and may signal the formation of strong breakout points, significant peaks, or troughs.
Suitable timeframes and market conditions: ADX is most effective in day trading strategies and fast-moving markets where reaction speed is key. Conversely, this indicator is less effective on longer timeframes or in sideways market conditions.
The holy grail trading strategy using ADX and MA Crossovers
The Holy Grail strategy is associated with Linda Bradford Raschke, a veteran American commodities and futures trader in the 1980s. This strategy uses the ADX indicator to confirm trend strength, and combines MA crossovers to identify entry points.
With this strategy, traders prioritize markets with strong trends confirmed by the ADX. Instead of entering trades immediately, they wait for a small correction to allow the price to cool down. When a moving average crossover signal appears, this is a high-probability entry point.
Setup rules:
The ADX remains above 30 and continues to rise, reflecting a strong current trend with good momentum.
Prices are showing signs of a short correction, returning to test a fast-moving average, such as the 20-period EMA.
Entry points are typically considered when the price breaks back above the moving average, in the same direction as the dominant market trend.
Suitable timeframes and market conditions: This strategy works well in markets with clear trends across multiple timeframes, from intraday to daily. Thanks to its ability to confirm trend strength, it helps eliminate false breakouts and provides highly reliable entry points once a trend has formed.
ADX and Parabolic SAR strategy
The ADX indicator serves to confirm the strength of the trend, while the Parabolic SAR helps identify entry and exit points for positions. This combination allows traders to trade with the trend more clearly and disciplinedly.
Parabolic SAR (Stop and Reverse) is used to identify stop-loss points and potential reversal signals. Meanwhile, ADX serves to confirm whether the current trend is strong and reliable enough to trade.
Setup rules:
The ADX remains above 25 and is trending upwards, indicating that the market is forming or maintaining a sufficiently strong trend to trade.
Traders typically open positions when the Parabolic SAR shows a reversal signal, confirming a change or continuation of the trend direction.
Parabolic SAR points are used as trailing stops, helping to protect profits and manage risk based on price movements.
Suitable timeframe & market conditions: This strategy works effectively with medium-term swing trading in clearly trending markets. ADX helps eliminate periods of noisy volatility, where Parabolic SAR often generates many false signals.
ADX combined with price divergence strategy
This strategy focuses on detecting divergence between the ADX indicator and price action. Divergence occurs when the price continues to create new highs or lows, while the ADX does not confirm them but instead forms lower highs or lows. This signal reflects weakening trend strength, even though the price continues to move in the same direction.
Setup rules:
First, confirm that the market is showing a clear trend.
Monitor price action to see if the price continues to form new highs or lows.
Simultaneously, observe the ADX indicator: if the ADX fails to establish new highs/troughs or begins to decline, this indicates that trend momentum is weakening and a reversal is likely to occur.
Suitable timeframe and market conditions: This strategy can be used across various timeframes and is particularly effective in identifying signs of weakness, reversal, or correction in a trend. Experienced traders often rely on these signals to consider taking profits or predict changes in market direction.
ADX and OBV trading strategy
By combining ADX and OBV, this strategy not only focuses on the direction of the trend but also confirms its strength through volume. The ADX indicator shows whether the trend is strong enough to trade, while OBV helps confirm whether money flow is supporting that trend. The consensus of the two indicators creates a more reliable signal.
Setup rules:
The ADX indicator needs to be above 25 and continue to rise, indicating that the current trend is strong enough to trade.
In an uptrend, the OBV line should simultaneously trend upwards, reflecting the accumulation of money flow and supporting the upward price momentum.
Conversely, in a downtrend, OBV typically declines, indicating that selling pressure is prevailing.
Traders should also pay attention to divergence between OBV and price, as this can be an early sign of a potential trend reversal.
Suitable timeframe and market conditions: This strategy can be flexibly applied across various timeframes and works best in markets with clear trends. Incorporating volume strengthens the credibility of trades, ensuring that price movements are supported by real money flow.
Advantage and disadvantages of using the ADX indicator
Understanding the advantages and limitations of the ADX indicator helps you effectively utilize its benefits while avoiding unnecessary risks during trading.
Advantage and disadvantages of using the ADX indicator
Advantage
Eliminate weak trends: The ADX indicator focuses on assessing trend strength, helping traders identify and avoid weak, directionless markets – where trend-following strategies are often ineffective.
Versatile across multiple timeframes: ADX is a highly applicable indicator that works well across all timeframes, from short-term charts for day trading to long-term charts for investment. This makes ADX suitable for a variety of trading styles and strategies.
Maximizing its effectiveness when combined with other tools: The ADX indicator does not operate independently but is designed to complement other technical indicators and models. Its main role is to confirm the validity of trading signals, thereby enhancing the reliability and overall effectiveness of the strategy.
Disadvantages
Slow reaction in the early stages of a trend: ADX is a lagging indicator because it is calculated based on already established price data. It often only confirms a trend after the movement has already begun, causing traders to potentially miss the early – the most profitable – phase of a new trend.
Easily confused in highly volatile markets: When the market is volatile or moving sideways, prices change rapidly but lack clear direction, and the ADX indicator may fluctuate around the 20–25 range. This makes the signals less clear and makes it difficult to accurately assess the strength of the trend.
Not suitable for standalone trading: ADX does not generate specific buy or sell signals but only reflects the strength or weakness of the trend. Using ADX alone to enter trades can easily lead to inaccurate decisions. To be effective, traders need to combine ADX with other technical indicators or analyze price action to determine appropriate entry and exit points.
Conclude
The ADX indicator is not designed for picking market tops or bottoms, instead, it focuses on confirming whether the current trend is strong enough to trade. By measuring trend strength, ADX helps traders avoid sideways market conditions and concentrate on higher-probability opportunities. According to pfinsight.net, when combined with price action, volume, or other trend indicators, ADX can become a core component of a robust trading system.