Moving average crossovers are an important tool that helps traders confirm trends instead of guessing tops and bottoms. When the short-term moving average crosses above or below the long-term moving average, a clear and credible trading signal emerges. In this article, PF Insight will analyze the advantages, disadvantages, and how to optimize moving average crossovers in real-world trading.
A moving average crossover (MA cross) occurs when a short-term moving average crosses above or below a long-term moving average. This reflects a change in the rate of price movement, as the faster-reacting MA surpasses the slower MA, thereby generating a potential trading signal.
This crossover reflects the possibility of a market reversal or a change in momentum. Traders often rely on this signal to identify entry points, exit points, or to eliminate underperforming trades.
How does MA cross provide buy and sell trading signals?
Moving average crossovers offer important insights into market trends, but interpreting the signal requires careful analysis. A MA crossover signal forms when two moving averages with different periods intersect. This event often reflects the possibility of a market reversal or the beginning of a new phase of movement.
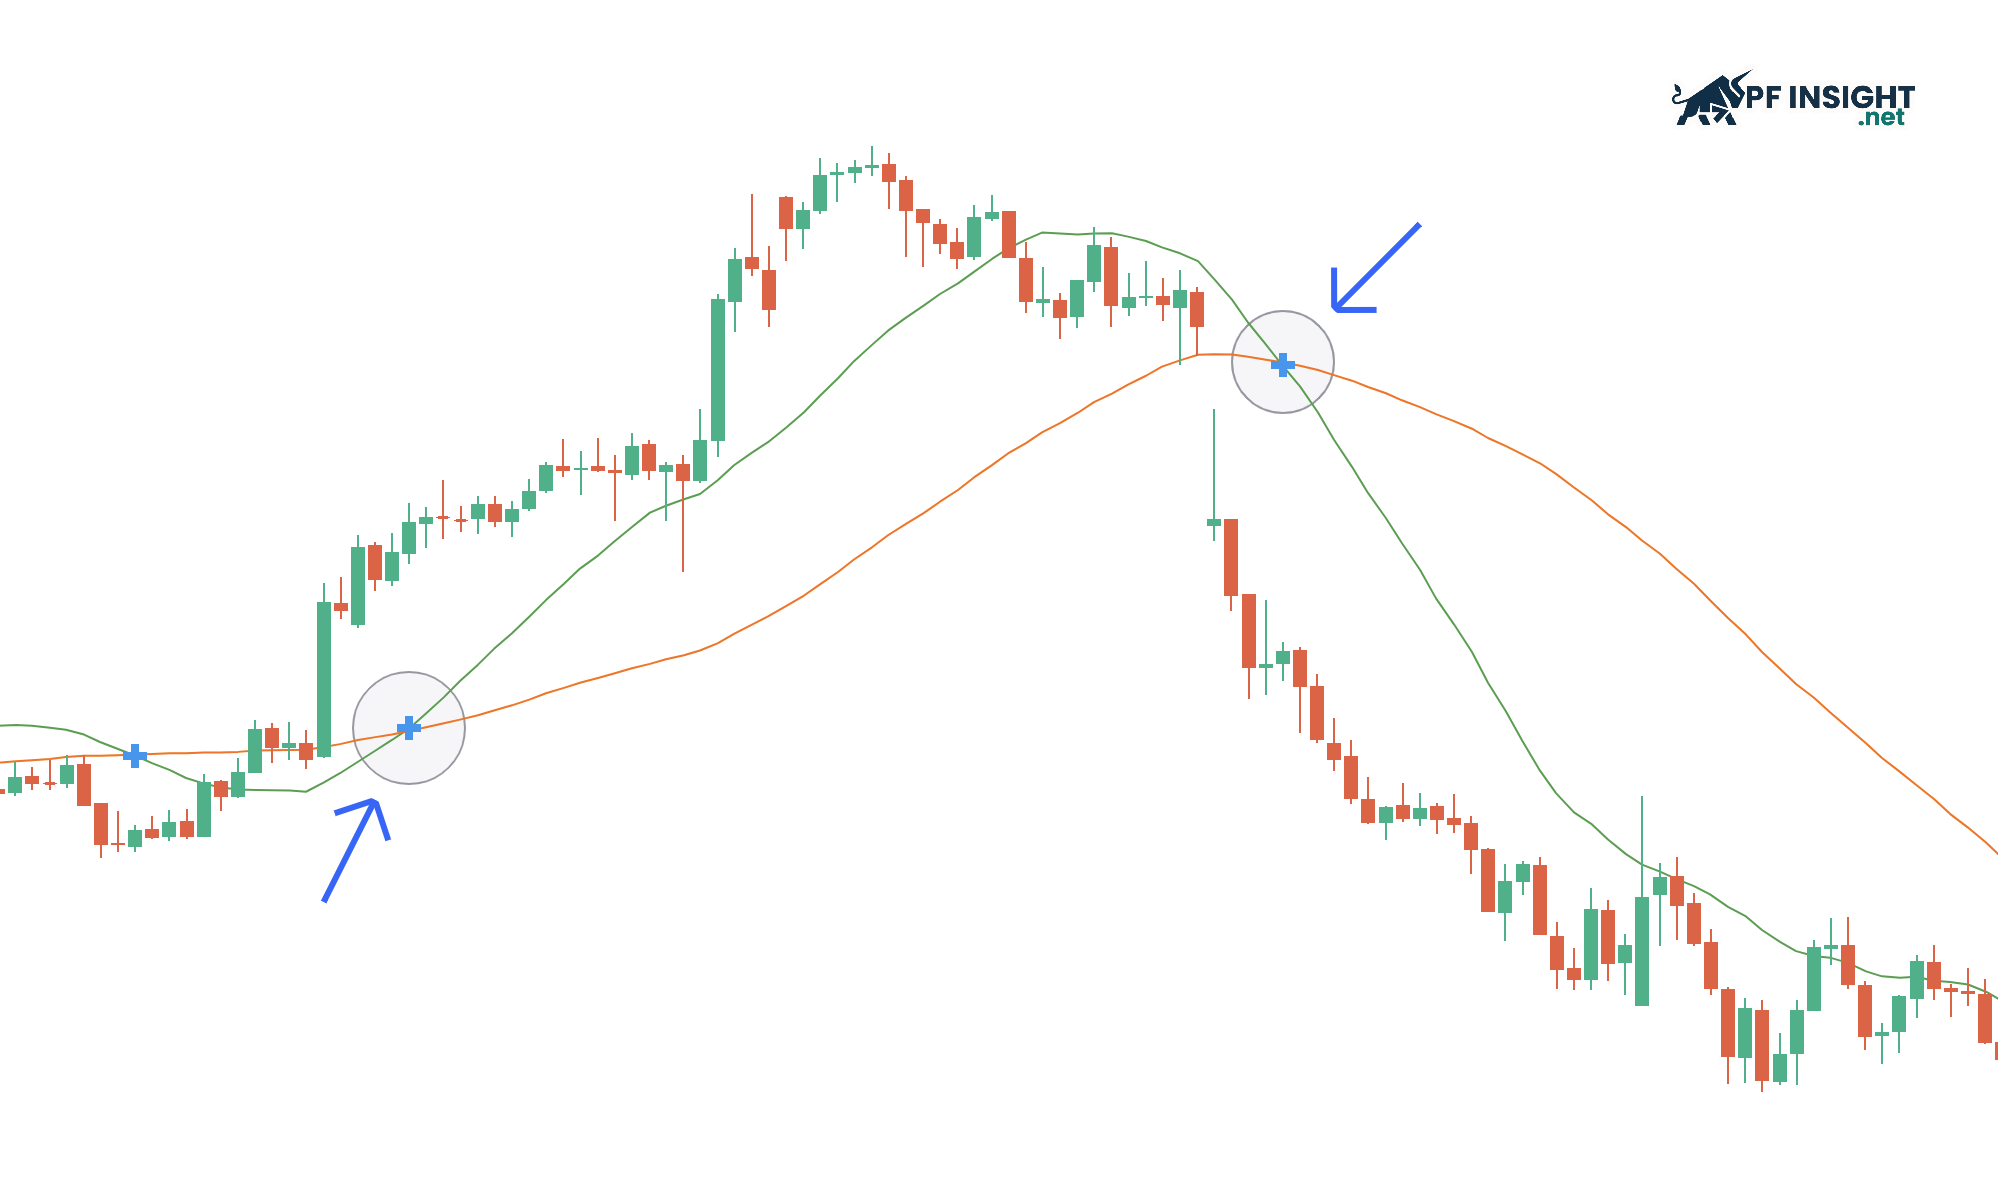
Bullish crossover signals: Bullish crossover signals appear when the short-term moving average crosses above the long-term moving average (MA), reflecting an increase in buying momentum. This signal often indicates an emerging uptrend and is used by many traders as a potential buy signal when the market begins to move upwards.
Bearish crossover signals: Conversely, a bearish crossover signal appears when the short-term moving average (MA) crosses below the long-term moving average (MA), reflecting increasing selling pressure. This is a sign of a potential downtrend and is used by traders as a sell signal in line with the market trend.
Although moving average crossovers provide clear signals, traders should not use them in isolation. Combining them with other technical indicators enhances signal reliability. Tools like RSI, MACD, and Bollinger Bands help confirm momentum, trends, and volatility, thereby assisting traders in making accurate trading decisions and minimizing noise signals.
Different types of moving average crossovers in trading
Moving average crossovers include two of the most common types: the Golden Cross and the Death Cross.
Golden cross
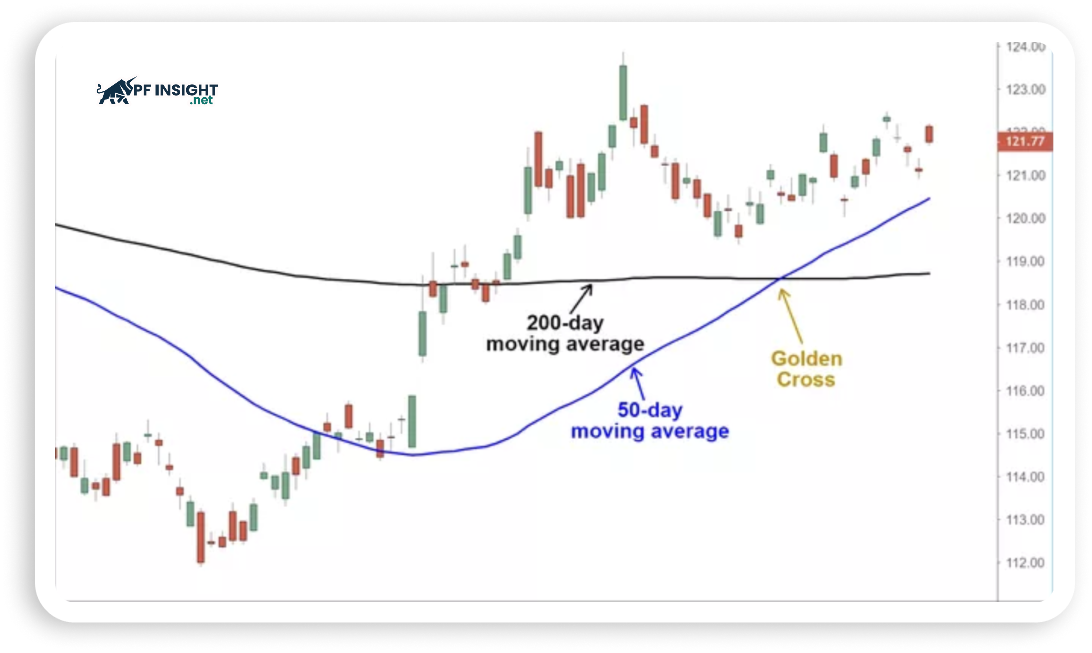
This signal often indicates a shift to a long-term uptrend
The Golden cross is considered an important indicator, appearing when the 50-day moving average crosses above the 200-day moving average. This signal often indicates a shift to a long-term uptrend and is used by many traders and investors to confirm a clear bull market.
The formation process of the Golden cross is divided into three important stages as follows:
As selling pressure gradually weakens, the market often shows signs of ending a downtrend, paving the way for the formation of a Golden cross.
In the next phase, the short-term moving average MA50 crosses above the MA200, confirming the trend reversal and breaking out of the sideways trading range.
Subsequently, the market quickly enters its final phase, characterized by a clear upward trend and often accompanied by sharp price increases.
Death cross
A death cross is a downward crossover of moving averages (MAs), reflecting a negative market reversal.
A death cross is a downward crossover of moving averages (MAs), reflecting a negative market reversal. When a short-term moving average crosses below a long-term moving average, typically the 50-day and 200-day MAs, a downtrend is clearly confirmed. Therefore, a death cross is often viewed by traders as a sell signal or a warning that the market may be entering a downturn cycle.
The process of a Death cross occurring involves three key stages:
Initially, the market maintained an upward trend as the short-term moving average (MA) was above the long-term moving average (MA).
In the next phase, the trend begins to reverse as the short-term moving average (MA) crosses below the long-term MA, signaling weakness.
Ultimately, a clear downtrend formed when the short-term moving average continued to decline and remained below the long-term moving average.
Advanced moving average crossover strategies for better trade entries
Moving average price crossover strategy
Moving average price crossover strategy
This is the simplest form of moving average crossover, where traders don’t compare two moving averages but focus on the relationship between price and a single MA line. This method helps identify the underlying trend of the market.
When the closing price is above the moving average, a buy signal is formed.
If the closing price is below the MA, a sell signal will appear.
In trading, moving averages are selected depending on the timeframe and investment objectives. Specifically:
The 20-day moving average (MA 20) is commonly used to track short-term volatility and react quickly to price changes.
The 50-day moving average (MA) is suitable for assessing medium-term trends, while the 200-day MA plays a crucial role in long-term analysis.
In particular, the 200-day moving average (MA 200) is of interest to institutional and financial investors; when the price remains above this line, the market is generally considered to be in a long-term uptrend.
MA crossover strategy with price action
MA crossover strategy with price action
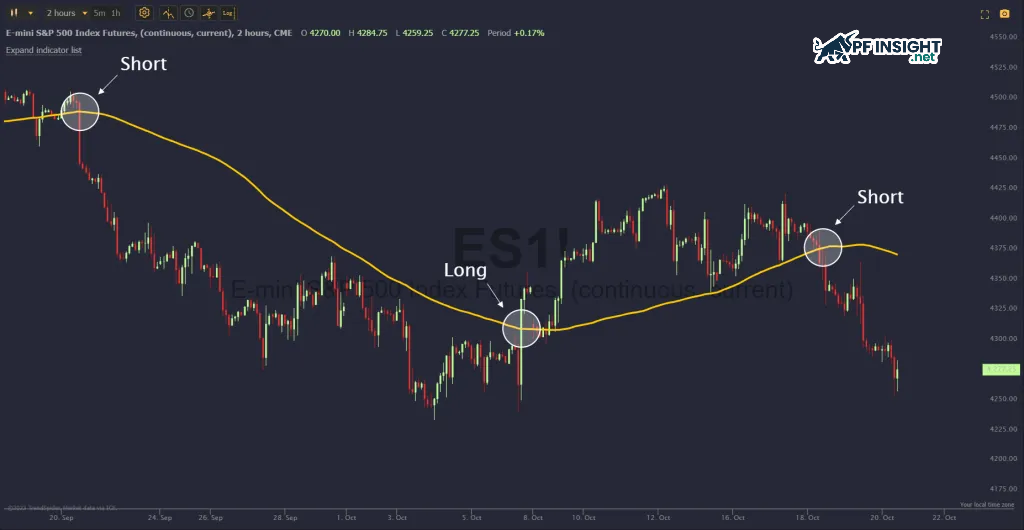
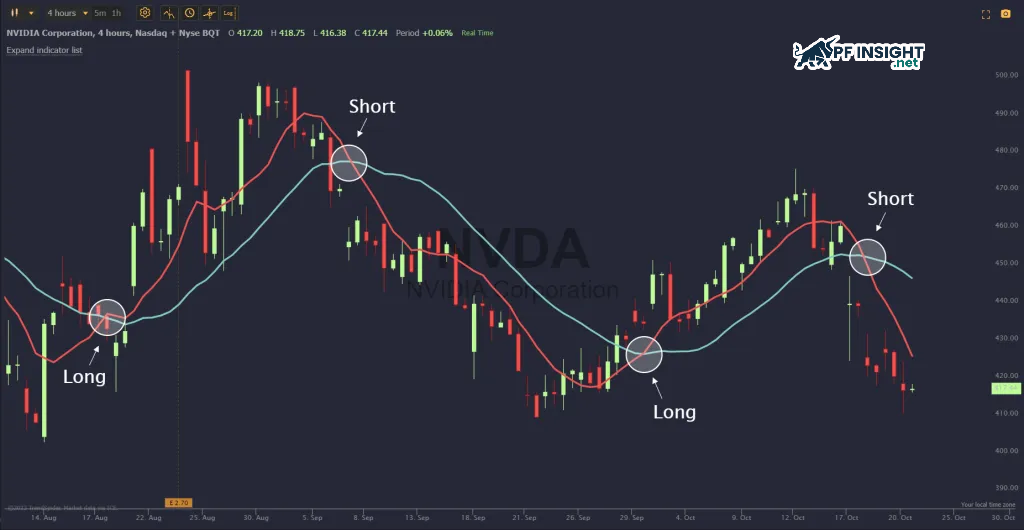
The moving average crossover strategy, combined with price action, helps traders identify the center of a trend and improve entry accuracy. By observing the interaction between price and two moving averages, traders can recognize opportune times to buy or sell. In this strategy, the 50-period MA typically represents the short-term trend, while the 200-period MA reflects the long-term market trend.
When the 50-period moving average (MA) crosses above the 200-period moving average (MA), the market is generally considered to be entering an uptrend. This signal indicates that buying pressure is dominant, and traders can consider entering the market or opening long positions in line with the trend.
Conversely, when the 50-period moving average (MA) crosses below the 200-period moving average (MA), this reflects a developing downtrend. In this case, traders typically view this as a signal to exit a buy order or open a sell position to capitalize on the market’s downward momentum.
Triple moving average crossover strategy
This strategy expands on the traditional crossover pattern by adding a moving average to enhance trend confirmation. When all three MAs move in the same direction and coincide, the market typically shows a more reliable trend reversal. This method is suitable for traders who employ a selective trading style, focusing on a few but high-quality entry points.
In practice, traders can use the trio of EMA 10, EMA 20, and EMA 50 to build trading strategies. EMA 10 reacts quickly to price fluctuations, EMA 20 acts as an intermediary, while EMA 50 confirms longer-term trends. However, this method generates fewer signals but offers higher reliability.
When the three EMA lines are arranged in ascending order, the buy signal is confirmed.
Conversely, a descending order indicates a sell signal.
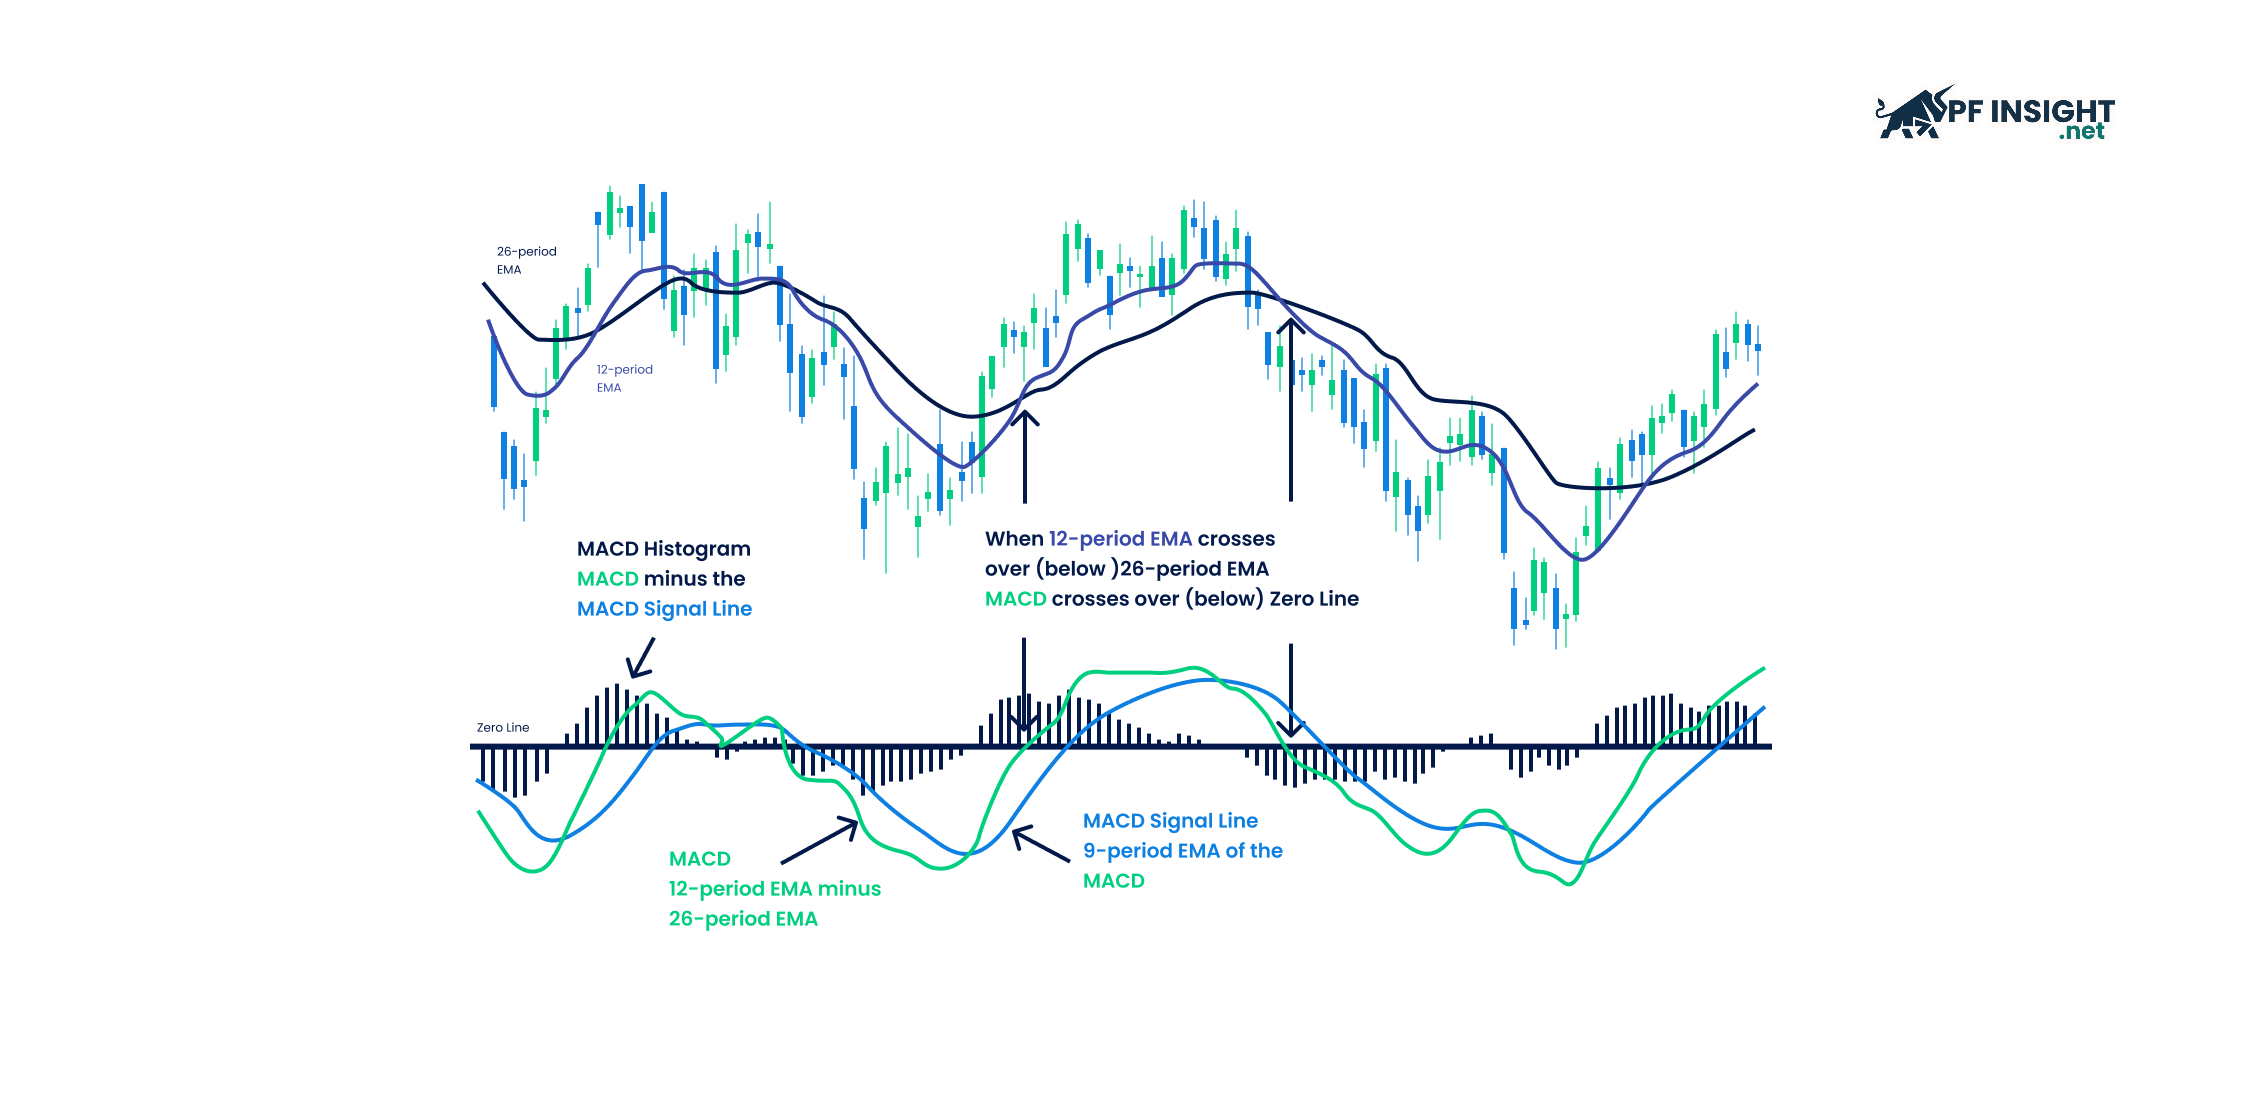
One of the most effective ways to optimize moving average crossovers is to combine them with the MACD indicator to confirm bullish or bearish market signals. MACD helps assess momentum and trend direction, thereby helping traders identify more appropriate entry and exit points. In practice, the 9-period EMA of the MACD is often considered a short-term MA, while the 26-period EMA acts as a long-term MA to confirm crossover signals.
A buy signal appears when the MACD line crosses above the short-term moving average, indicating that upward momentum is forming.
Conversely, a sell signal is confirmed when the MACD line crosses below the short-term moving average, reflecting downward pressure and the possibility of a continued market decline.
Moving average ribbon strategy
By using a group of multiple moving averages, this method creates a “ribbon-like” structure that helps assess the market trend. These MA bands show the stability, intensity, and direction of price movement. Through changes in the spacing and order of the MA lines, traders can detect acceleration, stagnation, or potential trend reversal signals.
The moving average ribbon strategy illustrates the overall trend structure, the strength of momentum, and the likelihood of continuation or reversal in the market. Specifically:
Ribbon expanding: Indicates a strong market trend with clear momentum.
Ribbon narrowing: Signals that the trend is slowing down or gradually weakening.
Ribbon reversal: Warns of a potential upcoming market reversal.
Through the ribbon structure, traders can clearly observe the strength and intensity of a trend. This method is very useful for long-term analysis and helps to detect early signals that a trend is losing momentum.
Double moving average crossover strategy
Double moving average crossover strategy
Among moving average crossover strategies, the two-moving average (MA) pattern is considered fundamental yet highly effective. By utilizing a short-term moving average and a long-term moving average, this method helps confirm trends and visually reflect changes in momentum. Traders rely on crossover signals to identify clear buy and sell points and trade in the main trend.
Open a buy order when the short-term moving average (MA) crosses above and is above the long-term moving average (MA).
Open a sell order when the short-term moving average crosses downwards and remains below the long-term moving average.
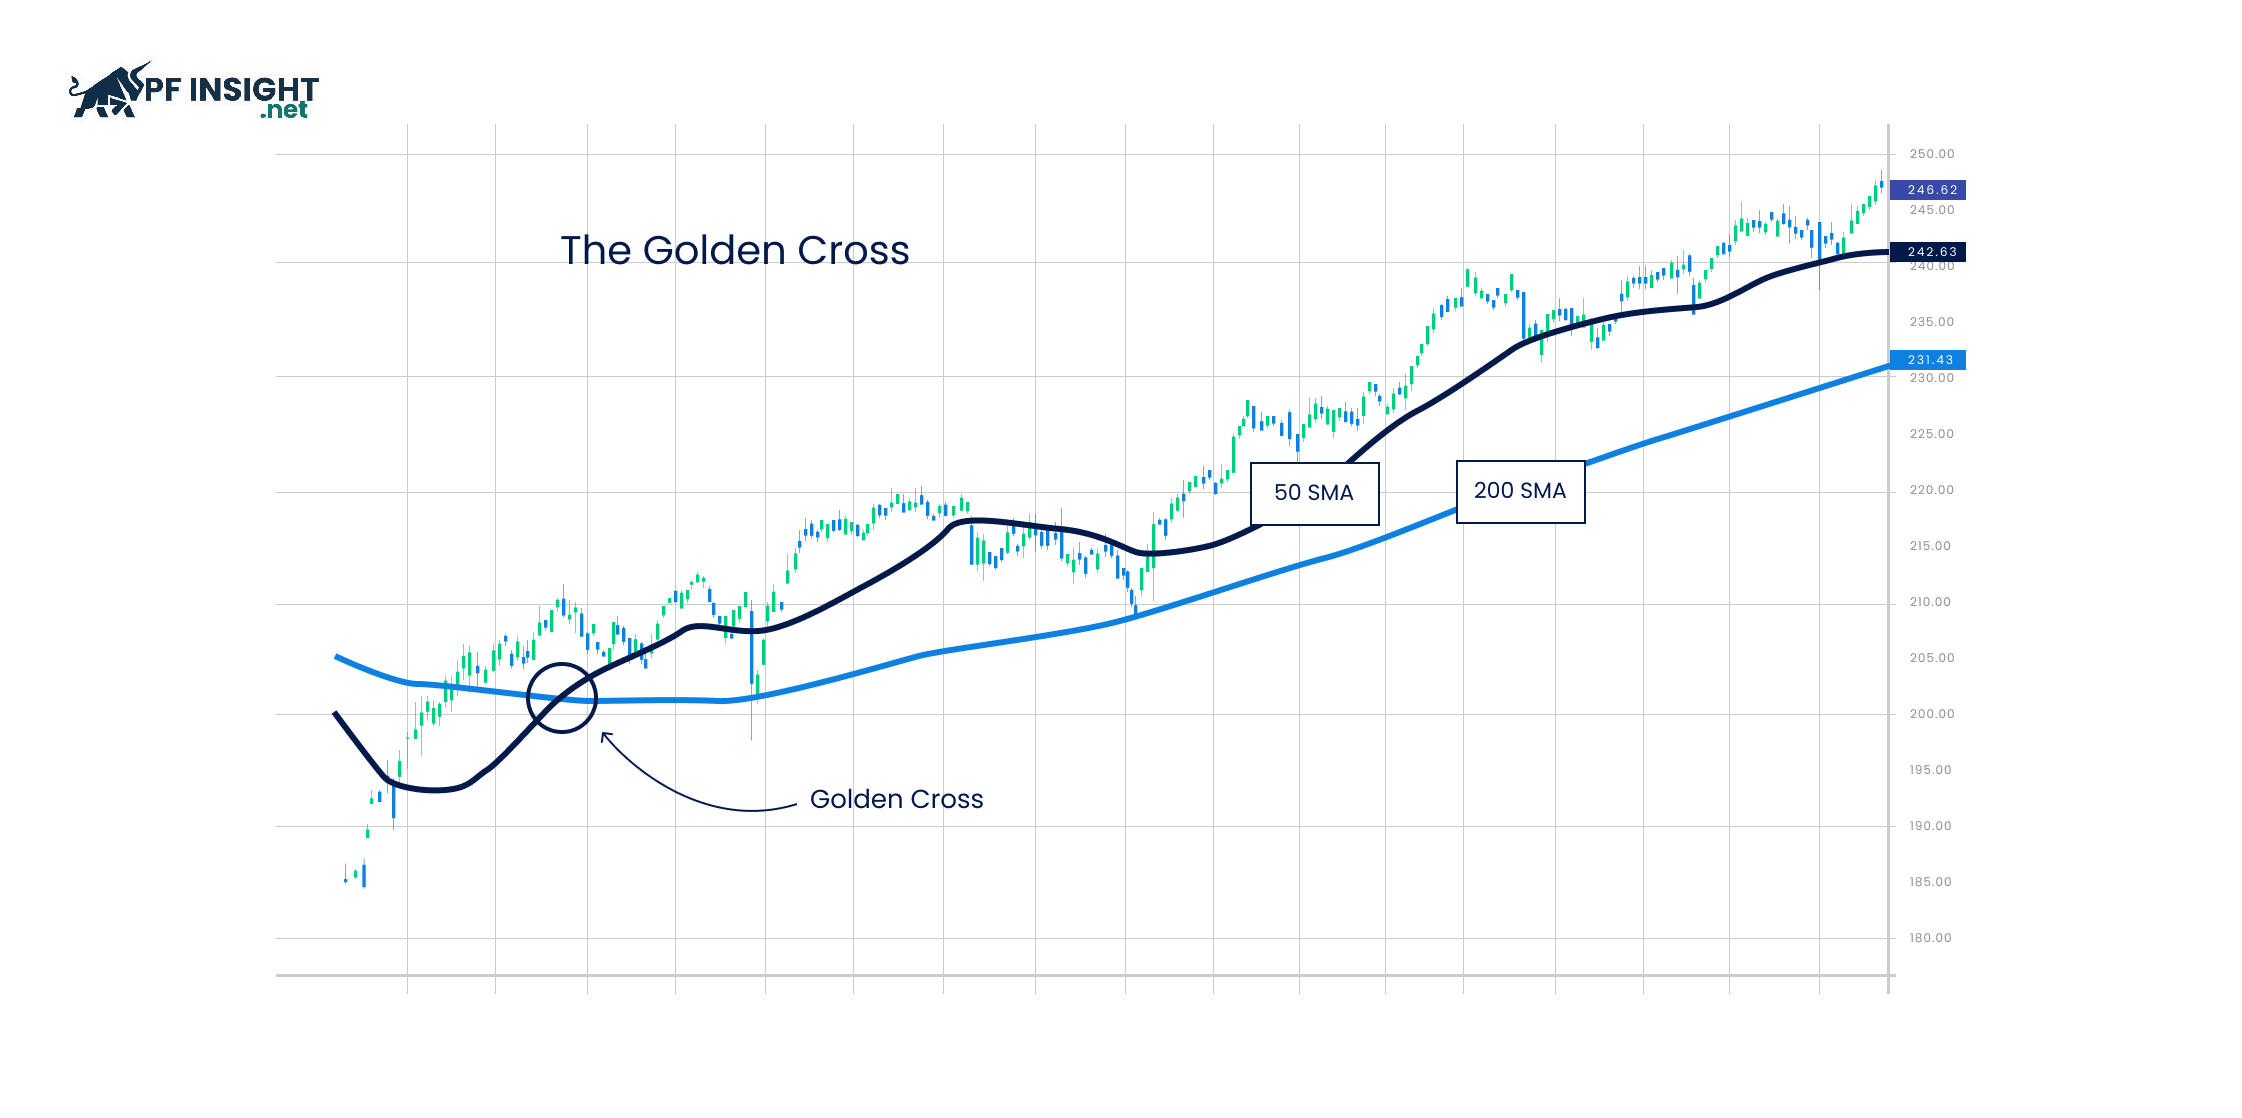
This strategy generates two important signals that many traders follow. Specifically:
A Golden cross occurs when the 50-day Simple Moving Average (SMA) crosses above the 200-day Simple Moving Average (SMA), which is generally considered a sign confirming a sustained uptrend.
Meanwhile, a Death cross appears when the 50-day Simple Moving Average (SMA) falls below the 200-day Simple Moving Average (SMA), signaling the potential formation of a prolonged downtrend in the market.
Advantages and disadvantages of MA cross
Like any other trading strategy, moving average crossover has its own strengths and weaknesses. Understanding the advantages and disadvantages of this method will help traders apply it effectively and avoid unnecessary mistakes.
Advantages of MA cross
Easy to access and implement: One of the outstanding advantages of moving average crossover is its simplicity of use. Moving averages are easy to calculate, and most trading platforms have built-in MA plotting tools. Thanks to its clear and intuitive concept, this strategy is suitable for both new and experienced traders.
Clearly defining trends: Moving averages help smooth price fluctuations and provide an overall view of market trends. Through MA crossover signals, traders can identify the main trend as well as detect early signs of potential reversals.
Flexible across multiple timeframes: Moving averages can be used effectively across various timeframes, from intraday trading to short-term and long-term. Traders can easily adjust the type of MA and parameters to suit their trading style, allowing the MA crossover strategy to adapt well to different market conditions.
Minimizing short-term price noise: Price fluctuations are often influenced by immediate factors and short-term news. Moving averages help smooth these oscillations, eliminating much of the market noise and allowing traders to focus more clearly on the asset’s main trend.
Disadvantages of MA cross
Signal response lag: Moving averages are constructed from past price data, so they have a certain lag. When the market experiences strong volatility or rapid reversals, MAs often react slowly, causing traders to enter orders late or miss potential trading opportunities.
Prone to false signals: In sideways or volatile market conditions, moving average crossovers can generate many false signals. The lack of a clear trend makes traders susceptible to “sweepsdowns” if they rely solely on MAs without additional confirmation tools.
Poor performance in trendless markets: The moving average crossover strategy is most effective when the market forms a clear trend, allowing traders to follow the upward or downward momentum of prices. Conversely, when the market is sideways or fluctuating within a narrow range, the moving averages constantly cross, creating noise signals.
Profit margins are narrowed: Due to the lagging nature of moving averages, traders may enter trades after the trend has been underway for some time or exit trades late, resulting in narrowed profits and increased risk.
Conclude
Moving average crossovers are not only trend-identifying tools but also the foundation for many advanced trading strategies. When used correctly, they help traders follow the major trend and limit emotional decisions. However, to achieve sustainable results, traders need to tightly control risk, patiently wait for clear signals, and not ignore the overall market context.