Momentum indicator trading is an indispensable tool for traders who want to gain a deeper understanding of price behavior in financial markets. By measuring the rate of price change, the Momentum indicator helps detect early signals of overbought, oversold, or weakening of the current trend. Applying the momentum indicator correctly will help traders make more informed trades, avoid emotional entry, and improve trading discipline.
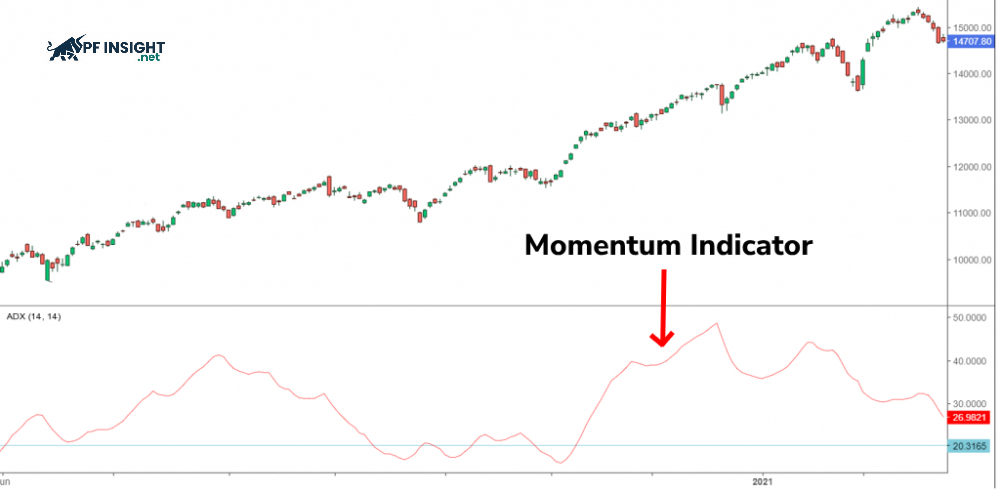
Momentum indicators reflect the rate of price fluctuations of an asset over time. Through this, traders can determine whether market momentum is strengthening or weakening, thereby predicting the likelihood of the current trend continuing or reversing.
Momentum indicators play a crucial role in technical analysis by helping traders measure the strength and speed of price trends. Based on this, traders can find suitable times to enter or exit the market. However, it should be noted that these indicators are not absolute predictors, and historical data only reflects the past, not guaranteeing future trading results.
Momentum’s characteristics
Momentum indicators reflect the rate of price fluctuations of an asset over time.
Understanding the characteristics of momentum helps traders grasp market dynamics, identify strong and weak trends, and optimize their trading strategies.
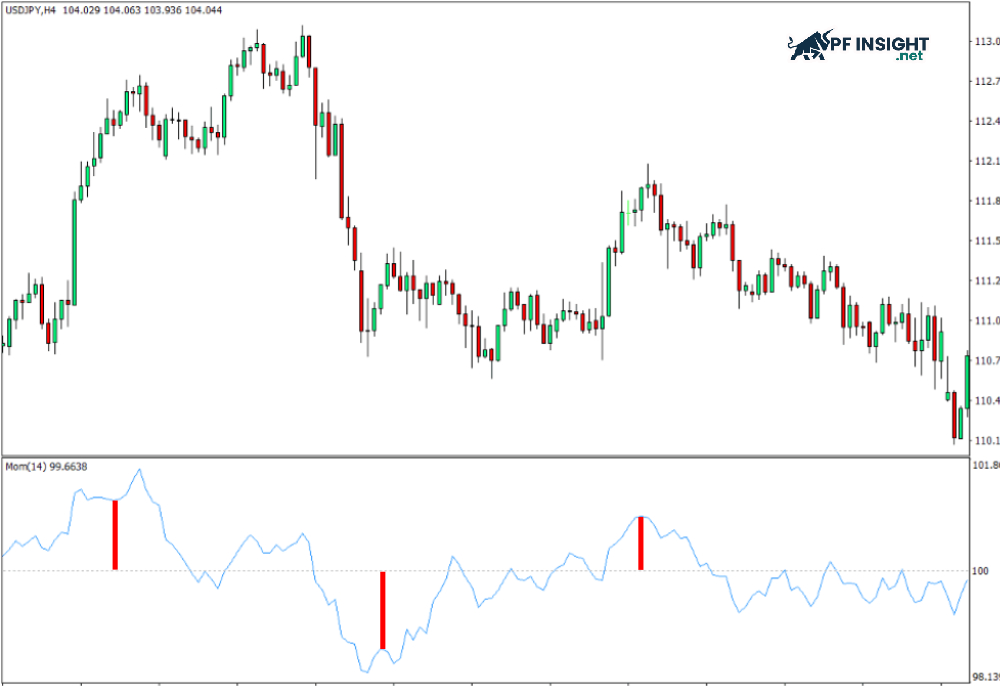
Momentum indicators consist of an oscillating line (usually displayed in blue) and a reference line at zero, helping traders assess the strength or weakness of a trend.
When momentum fluctuates around zero, the price typically doesn’t form a clear trend and tends to move sideways.
Momentum lines continuously oscillate around a reference line, where the difference between the two lines serves as a measure of price volatility. A larger gap indicates strong price movement and a faster market pace, while a smaller gap reflects weak and slow volatility.
When using momentum indicator trading, the distance between the Momentum line and the reference line plays a crucial role in determining the strength and movement of the market trend.
Factors affecting momentum indicator signals
Momentum indicator trading can be affected by various market factors, directly impacting the accuracy and reliability of trading signals.
Trading volume
In trading, trading volume indicates the level of market activity over a defined period. This factor directly impacts the effectiveness of momentum indicators, as stable volume helps confirm the strength of price movements. This allows traders to make entry and exit decisions based on the participation of buyers and sellers.
Momentum indicator trading works most effectively in markets with high liquidity and stable trading volume. In such conditions, price momentum accurately reflects the participation of buyers and sellers. If volume is low, inconsistent price movements make it difficult for momentum indicators to accurately determine market trends.
Timeframe
Momentum indicator trading strategies typically rely on signals formed in short timeframes, where price momentum is most evident. If the trend maintains its strength in the short term, momentum indicators will assist traders in making accurate entry and exit decisions. Conversely, when market strength is unsustainable, momentum indicators may give misleading signals or provide no trading signals at all.
Market volatility
Volatility plays a crucial role in helping momentum indicators generate effective trading signals. This factor reflects the degree of price fluctuation during trading. When the market is highly volatile, prices typically move with larger and more pronounced amplitudes. Conversely, less volatile markets are usually accompanied by small and uninspired price movements.
By analyzing short-term price fluctuations, momentum indicators help traders understand market movements. These signals aid in identifying effective entry and exit points, especially during periods of unpredictable market volatility.
How to read and analyze the momentum indicator effectively
How to read and analyze the momentum indicator effectively
To assess market trends, momentum indicators use two key values as the basis for analyzing price momentum.
MOM > 100: The market is showing that the current price is above the past price (n sessions ago).
MOM < 100: The current price is lower than the price recorded in the previous session (n), reflecting downward momentum.
When the MOM line crosses above the 100 reference level with a large deviation, it indicates a strong uptrend and high price movement. Conversely, if the MOM is below 100 and the distance is greater, a downtrend is more evident with a faster rate of decline.
The MOM value reflects the strength of the price trend. The higher the MOM above 100, the greater the upward momentum; for example, a MOM of 103 indicates a stronger upward trend than a MOM of 102. Conversely, the lower the MOM below 100, the clearer the downward trend; for instance, a MOM of 97 indicates a stronger decline than a MOM of 98.
Effective momentum indicator trading strategies for traders
Below are widely used momentum indicator trading strategies that help many traders and investors identify effective entry and exit points for trades.
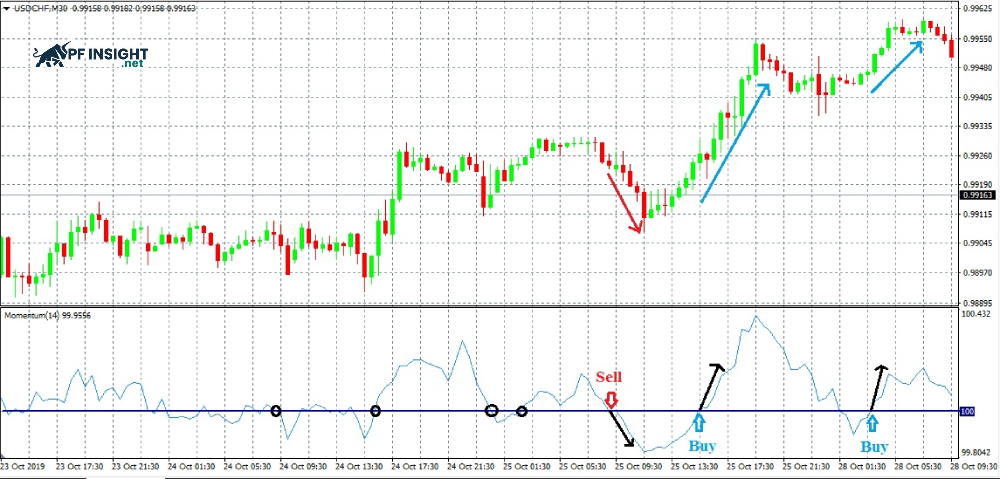
Trading signals from the momentum indicator crossing the 100 reference line
When the MOM line moves upwards and crosses the 100 mark, it indicates that upward momentum is forming and the uptrend is likely to continue. In this context, the market is leaning towards the buying side, and traders may consider opening appropriate buy orders.
When the MOM line moves downwards and crosses the 100 mark, it indicates increasing downward momentum and selling pressure. The downtrend is likely to continue, so traders may consider opening sell orders under suitable conditions.
Trading signals from the momentum indicator crossing the 100 reference line
How to execute the transaction:
Entry: For a Buy order, the appropriate entry point is a bullish candle confirming the signal at the crossover zone. Conversely, a Sell order should be triggered by a bearish candle confirming the downtrend.
Stop loss: Buy orders should be placed below the main support zone, sell orders should be placed above the strong resistance zone.
Take profit: This can be based on the profit/risk ratio or a combination of Fibonacci analysis, moving averages, and key technical levels.
Note: Momentum indicator trading should not be used in isolation because crossovers between MOM and the 100 mark occur quite frequently. Combining it with other indicators will help filter out noise and improve the reliability of trading signals.
Trading based on the crossover between momentum and the MA
Momentum indicator trading utilizes the crossover point between MOM and MA to identify potential trend reversal signals. Traders can customize the MA period according to their personal strategy, with levels of 9, 14, and 21 being widely used. MAs with longer periods reflect more stable trends and reduce noise signals.
Next, traders will base their entry decisions on the relationship and crossover signals between the MA line and the momentum indicator. Specifically:
Trading based on the crossover between momentum and the MA
Buy: When the Momentum Indicator rises and crosses the MA line, this indicates that buying pressure is strengthening, and investors can consider opening a Buy order.
Sell: Conversely, if the Momentum Indicator falls and crosses below the MA, selling pressure prevails and a Sell order may be considered.
Entry methods using momentum divergence or convergence signals
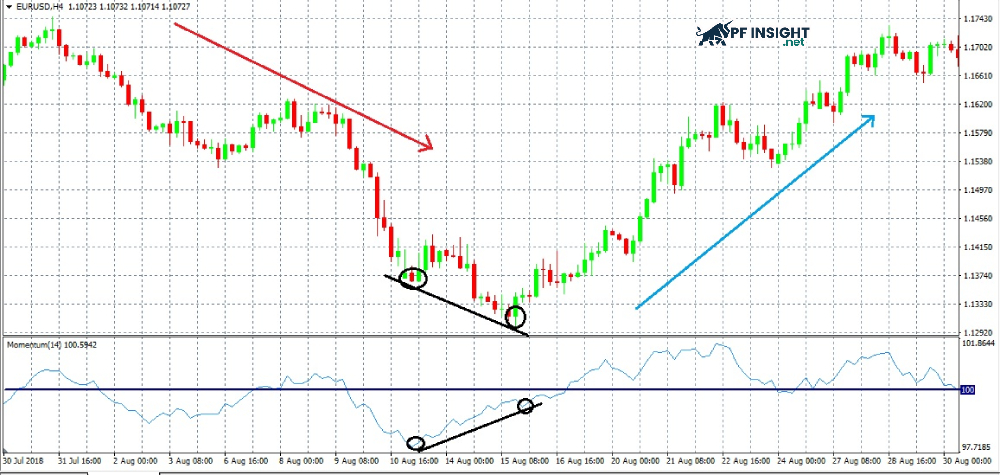
Momentum indicator trading uses the relationship between the peaks and troughs of the MOM line and the price line to identify whether the market is diverging or converging.
Divergence: The momentum indicator forms a lower high after a previous high, while the price line creates a higher high, indicating that momentum is weakening.
Convergence: The Momentum indicator creates a higher low after a previous low, but the price continues to form lower lows, reflecting a renewed consensus in the trend.
Based on divergence or convergence signals, investors can assess the likelihood that the market trend is weakening or preparing to reverse.
Entry methods using momentum divergence or convergence signals
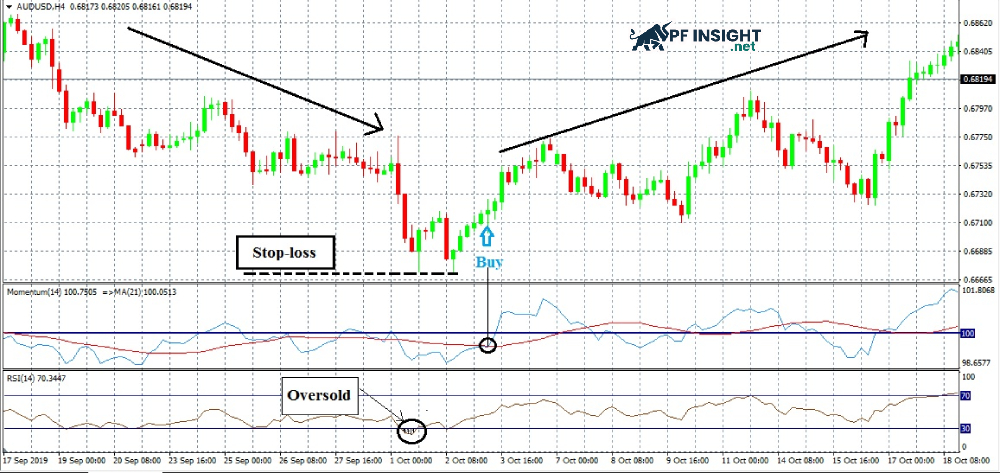
Buy order:
The market is in a downtrend, but momentum is starting to weaken. A convergence signal is appearing between the MOM line and the price line, suggesting a potential reversal. If the MOM line simultaneously crosses above 100 from below, the signal will be more reliable.
Entry: A buy order is triggered when the third green candlestick appears, confirming the trend reversal.
Stop loss: Place it at the nearest low or below the support level.
Take profit: Can be set according to a risk-reward ratio plan or based on Fibonacci levels.
Sell order:
The market is in an uptrend, but momentum is starting to weaken. Simultaneously, a divergence signal has appeared between the MOM line and the price line.
Entry: A Sell order is triggered when the third red candlestick appears, confirming the reversal signal.
Stop loss: Place it above the nearest peak.
Take profit: This can be set based on the risk-reward ratio or key Fibonacci levels.
In reality, divergence or convergence doesn’t always generate strong reversal signals. In some cases, the signals are quite weak, especially when the market is following a major trend. In such situations, Momentum indicator trading can generate noise and mislead investors. Therefore, one shouldn’t rely solely on the relationship between the MOM line and price, but should combine it with the trend, resistance/support levels, and other indicators.
Common mistakes to avoid when analyzing with the momentum Indicator
Common mistakes to avoid when analyzing with the momentum Indicator
Although momentum indicator trading helps improve trend identification, traders still need to remember some principles to ensure the accuracy of their entry decisions.
Trend-following trading: Market trends often last longer than predicted, so constantly trying to catch reversals can easily lead to losses and negative sentiment. Traders should prioritize finding buy signals in uptrends and sell signals in downtrends to increase their chances of success.
Combining multiple indicators: Relying on a single indicator can easily lead to noisy signals. Many traders choose to combine lagging indicators like MACD with leading indicators like RSI. Combining two to three tools will help confirm signals better and improve trading accuracy.
Beware of noise signals: Momentum indicator trading sometimes gives inaccurate signals, especially when the market is sideways or highly volatile. Therefore, traders need to be patient and wait for further confirmation signals before entering a trade to minimize risk.
Avoid relying solely on indicators: While momentum indicators offer valuable insights, relying solely on them while ignoring price action, market structure, or fundamental factors can lead to flawed decisions. Combine momentum indicators with other analytical tools to build more effective trading strategies.
Misapplication in the market context: Each momentum indicator is only effective under specific market conditions. Some indicators are suitable for trending markets, while others work better when prices are sideways. Traders need to identify the correct context before using them.
Ignoring other factors: Price action, trading volume, and economic news all play a crucial role in market analysis. Relying solely on momentum while ignoring these factors can lead to inaccurate trading decisions.
Conclude
As can be seen, momentum indicator trading offers many advantages in identifying entry and exit points based on price momentum. However, this indicator still has limitations when the market is highly volatile or moving sideways. According to pfinsight.net, traders need to thoroughly understand the nature of the indicator, choose the appropriate timeframe, and combine it with other technical factors to build a more sustainable and stable trading strategy.