
Support and resistance are foundational concepts that help traders understand how price reacts at key areas on a chart. Learning how price pauses, bounces, or stalls at these zones is the first step toward reading charts in a systematic way. This article focuses on clarifying the most basic concepts, making it suitable for traders who are learning technical analysis. Today’s article from Pfinsight.net is designed to provide support and resistance basics for traders who are studying technical analysis.
- Market cycles in trading and how price moves through different phases
- The trendline breakout strategy explained with clear entry and confirmation rules
- Volatility trading concepts that help traders adapt to changing market conditions
What are support and resistance in technical analysis
In technical analysis, support and resistance are price areas where the market often shows notable reactions. These are zones where price momentum tends to slow down, pause, or change direction due to the interaction between buying and selling pressure.
Support is a price area where buying pressure begins to increase enough to prevent the price from falling further. When price approaches this area, more traders are willing to buy, causing the downward momentum to weaken. In contrast, resistance is a price area where selling pressure increases, making it difficult for the price to continue rising as buyers become more cautious.
An important point about support and resistance is that they should not be viewed as exact price levels. In practice, they usually exist as price zones where market behavior tends to repeat over time. Understanding this nature helps traders read charts in a more structured way and avoid unrealistic expectations when analyzing price.
Why support and resistance basics matter to traders
Support and resistance act as reference points that help traders understand the structure of price movement. Instead of viewing the market as a series of random fluctuations, these price zones help identify areas where price is more likely to slow down, react, or change direction.
Identifying support and resistance allows traders to make more informed decisions, especially when determining reasonable entry and exit points. When price approaches areas that have triggered reactions in the past, traders can better assess whether price is likely to bounce or continue breaking through, which supports more effective risk control.
Beyond technical aspects, support and resistance also reflect market behavior and psychology. Many traders observe the same price zones and tend to act in similar ways, causing these areas to gain importance over time. This repetition of behavior is why support and resistance levels often continue to remain relevant.
Understanding the basics of support and resistance does not enable traders to predict the future with precision, but it provides a clear analytical framework for making consistent decisions. This is a necessary foundation before combining these concepts with more advanced tools or strategies.
How support and resistance form in price charts
Support and resistance are formed through repeated price reactions at specific areas on a chart. When the balance between buying and selling pressure shifts, price tends to slow down, pause, or reverse, creating zones that traders can observe and mark over time.
How support levels form in price charts
Support appears when the price moves down to a lower area and begins to encounter increasing buying pressure. In these areas, many market participants view the price level as attractive, leading to higher buying demand and a weakening of the downward move.
When buying pressure becomes strong enough to balance or exceed selling pressure, price no longer continues to fall as before. If this reaction occurs repeatedly, the price zone is gradually confirmed as support, reflecting an area where the market has been willing to absorb selling pressure.
How resistance levels form in price charts
Resistance forms in the opposite way when price moves into higher areas and selling pressure starts to increase. In these zones, buyers become more cautious, while sellers are more willing to take profits or open new positions.
When selling pressure dominates, price struggles to move higher and may stall or reverse downward. Over time, if price repeatedly fails to break through the same area, that zone is recognized as resistance, representing where the market typically lacks the momentum to continue rising.
Identifying support and resistance on charts
Support and resistance can be identified in many different ways, but for traders who are learning the basics, starting with simple and visual methods is the most effective approach. These methods help highlight areas where price has reacted strongly in the past and may continue to influence price behavior.
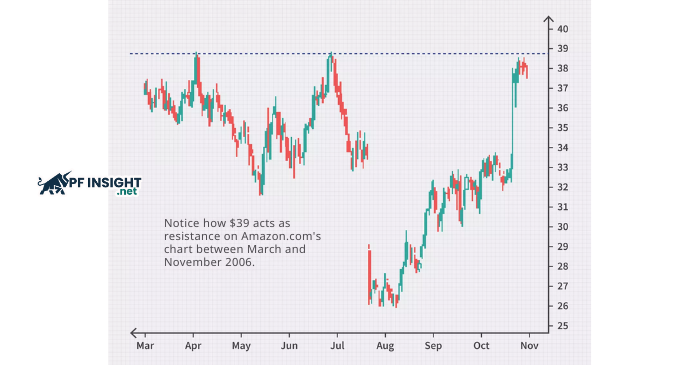
On a price chart, support and resistance zones often form at levels where the market repeatedly reacts in a similar way. The example below illustrates a clear resistance zone, where price consistently encounters selling pressure each time it approaches the same area.
Horizontal levels
Horizontal levels are the most common way to identify support and resistance. They form when price repeatedly creates lows or highs around the same price area. When these reactions occur multiple times, the price zone becomes a clear reference point on the chart.
Trendlines
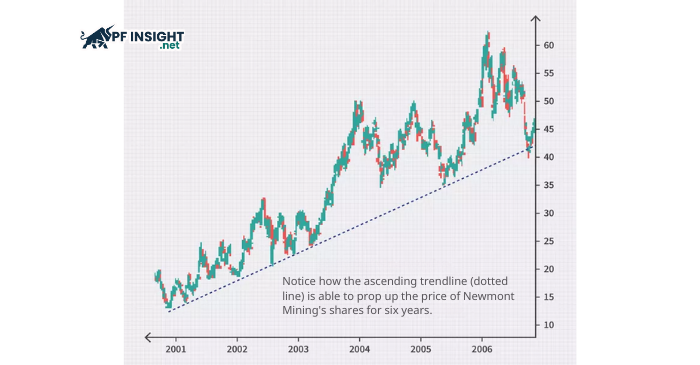
Trendlines help identify dynamic support and resistance when the market is trending. In an uptrend, a line connecting higher lows often acts as support. In a downtrend, a line connecting lower highs typically functions as resistance. In trending markets, support and resistance often appear as dynamic levels rather than fixed price zones. The chart below shows how an ascending trendline can act as support over an extended period.
Moving averages
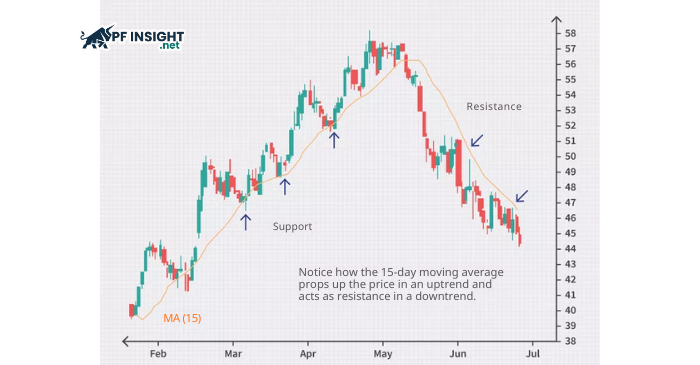
Moving averages are often used as flexible support and resistance levels. When price is above the moving average, it tends to act as support. When price is below it, the moving average often becomes resistance. This method is especially useful for traders who struggle with drawing trendlines manually. Moving averages are often used as dynamic support and resistance levels that adjust as price changes. The example below shows how a moving average can support price during an uptrend and act as resistance during a downtrend.
Round numbers
Round numbers such as 50, 100, or 1,000 often carry strong psychological significance. Many buy orders, sell orders, and stop losses are placed around these levels, causing them to frequently act as natural support or resistance on the chart.
Common mistakes when using support and resistance
One of the reasons traders struggle when applying support and resistance is due to incorrect expectations from the outset. Although the concept is relatively simple, using it improperly can lead to ineffective decisions.
- Viewing support and resistance as exact price levels: Many traders draw a thin line and expect price to react precisely at that level. In reality, support and resistance usually function as price zones, where reactions can occur within a range rather than at a fixed number.
- Ignoring trend context: Support and resistance do not exist in isolation. Applying the same approach in a strongly trending market and in a sideways market often leads to poor results. Trend context helps determine whether a support zone is likely to hold or more likely to be broken.
- Expecting support and resistance to always hold: No price zone works indefinitely. When price breaks through a support or resistance area, it reflects a shift in supply and demand. Attempting to trade against this movement without a proper risk management plan often results in unnecessary losses.
Key takeaways for traders learning technical analysis

Support and resistance are not tools for precisely predicting the next price movement, but reference frameworks that help traders understand where the market is reacting and why. When used correctly, these price zones make chart reading more structured rather than driven by intuition.
For traders learning technical analysis, the key points to remember include:
- Support and resistance should be viewed as price zones, not fixed levels.
- The effectiveness of these zones depends heavily on trend context and market behavior.
- A break of a support or resistance zone reflects a shift in supply and demand, not a failure of the method.
A consistent and flexible approach to support and resistance helps traders build a solid analytical foundation before combining them with more advanced tools or strategies.
Conclusion
Support and resistance basics provide traders with a clear framework for understanding how price behaves around key levels on a chart. When approached with flexibility and proper context, these concepts help transform price movements into meaningful structure rather than random fluctuations. Mastering the basics does not happen overnight, but consistent observation and practice will gradually sharpen your chart-reading skills. As with any trading concept, patience and discipline play a critical role in applying support and resistance effectively.
We wish you successful trading and the ability to build a strong foundation in technical analysis.


