
Mean Reversion trading focuses on exploiting temporary market imbalances when prices move away from the average. This method is not suitable for emotional trading but requires discipline, patience, and the ability to assess the overall context. Combining technical indicators with strict capital management principles helps increase the probability of success. In this article, PF Insight will analyze the indicator and how to apply the optimal strategy.
- VWAP trading strategy how traders use VWAP in intraday trading
- Pivot Points Trading strategy for support and resistance
- What is the ATR Indicator and how it works in trading
What is Mean Reversion?
Mean Reversion trading exploits the trend of prices returning to the average level after periods of sharp volatility. By combining multiple technical indicators, traders can detect short-term imbalances and predict potential market corrections.
Mean Reversion is the principle that financial indicators and asset prices will return to their historical averages after periods of unusual volatility. This deviation is often caused by short-term impacts from news, market expectations, or crowd behavior. In the long term, as temporary factors are absorbed, the market tends to correct and bring prices back to a more stable average range.
What factors drive price reversion in financial markets?

Mean reversion trading is driven by a variety of market factors. These factors cause short-term price fluctuations and increase the probability of the price returning to the average level.
- Price discrepancy opportunities: When an asset is listed at different prices across multiple exchanges, investors quickly exploit this gap to seek near-risk-free profits. Buying low and selling high occur simultaneously, creating supply and demand pressure that eliminates price anomalies. This process not only narrows price gaps but also pushes prices back to equilibrium and reinforces the principle of mean regression.
- Trader psychology: Mean Reversion trading explains that many price fluctuations do not stem from intrinsic value but from the emotional behavior of investors. During periods of instability, fear often leads to mass sell-offs, causing prices to fall sharply. Conversely, excessive optimism often pushes prices too high. When the market absorbs sufficient information and sentiment stabilizes, prices usually adjust back to a reasonable level, reflecting the principle of regression to the mean value.
- The basic elements of an asset: Mean Reversion trading is based on the assumption that asset prices cannot be separated from fundamental factors in the long term. For stocks, fair value is typically determined through indicators such as earnings, net worth, or firm valuation. However, temporary supply-demand imbalances can push prices too far from this baseline. It is these deviations that create opportunities for price corrections and regressions back to the mean.
- Statistical laws: Statistical analyses indicate that many phenomena in nature and financial markets tend to converge around a central value. In a competitive trading environment, prices fluctuate constantly but rarely remain too far from the average for extended periods. Therefore, the adjustment back to the average is not merely conceptual but reflects a fundamental statistical law governing price behavior in the market.
How to calculate Mean Reversion
In Mean Reversion trading, the calculation process focuses on measuring the extent to which prices deviate from their historical averages through statistical and quantitative methods. These measurements help determine the potential for future price corrections.
Step 1: Collect historical price data
When applying Mean Reversion trading, traders need to collect historical price data over a defined period. Depending on the investment or short-term trading objective, different timeframes are selected before determining the corresponding average price.
Mean = Sum of prices of Prices / Number of observations
Step 2: Calculate the deviation for each price level
Based on the determined average price, the deviation of each price level is calculated to reflect the distance between the current price and the equilibrium level.
Formula for calculating deviation:
Deviation = Price − Mean
Step 3: Calculate the standard deviation of the price series
In Mean Reversion trading, standard deviation is used to measure the degree of price volatility relative to the mean. This indicator helps traders assess the range of price fluctuations. The larger the standard deviation, the stronger the volatility and the wider the price dispersion; conversely, a small standard deviation reflects a more stable market state.
Formula for calculating standard deviation:
Standard deviation = Square root (Sum of squared deviations / (Number of observations −1)
Step 4: Calculate the Z-score
The Z-score is a statistical indicator that reflects how many standard deviations a price has from the mean. In finance, particularly with regression to the mean strategy, the Z-score helps identify unusual price movements that are likely to correct.
Formula for calculating the Z-score:
Z – Score = Deviation / Standard deviation
When the Z-score rises above common thresholds such as 1.5 or 2, this usually reflects an overvalued asset. Conversely, a Z-score falling below -1.5 or -2 suggests the asset may be undervalued.
Common indicators in Mean Reversion trading
Mean reversal trading is typically implemented through trading systems that utilize technical indicators as a foundation. These indicators help identify the extent to which price deviates from equilibrium and assist in finding reversal opportunities.
Bollinger Bands
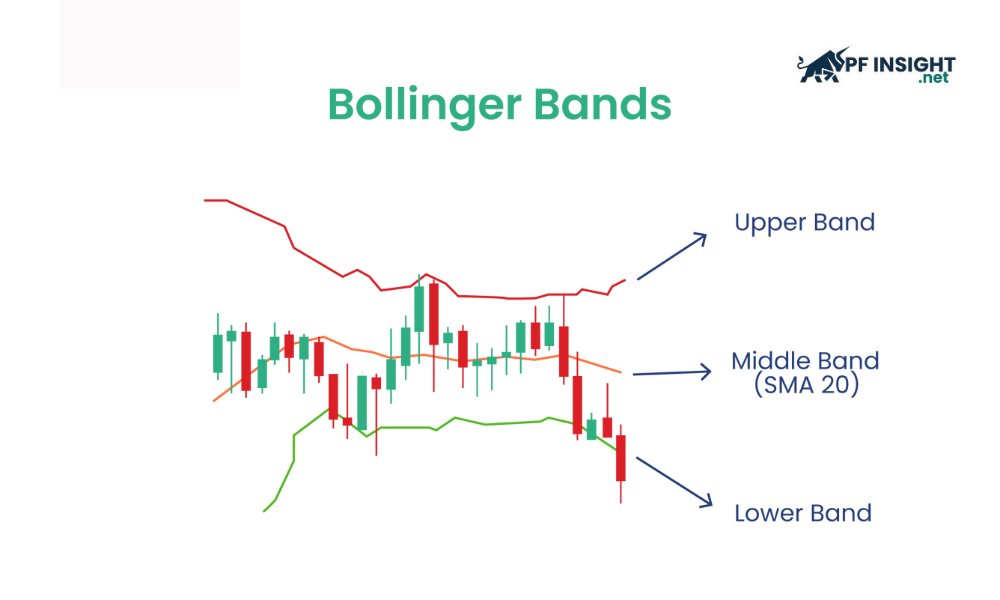
In Mean Reversion trading, Bollinger Bands help identify potential price reversal zones. The indicator’s structure consists of a central moving average and two bands spaced two standard deviations apart. Specifically:
- Price breaking above the upper band: This indicates the asset is likely to be overbought, increasing the probability that the price will correct downwards and return to the average range.
- Price breaking below the lower band: This reflects that the asset may be oversold, thus opening up the possibility of an upward correction and a return to the average price.
By measuring volatility, Bollinger Bands help traders identify periods when prices have moved too far and are trending back towards the average level.
Relative Strength Index (RSI)
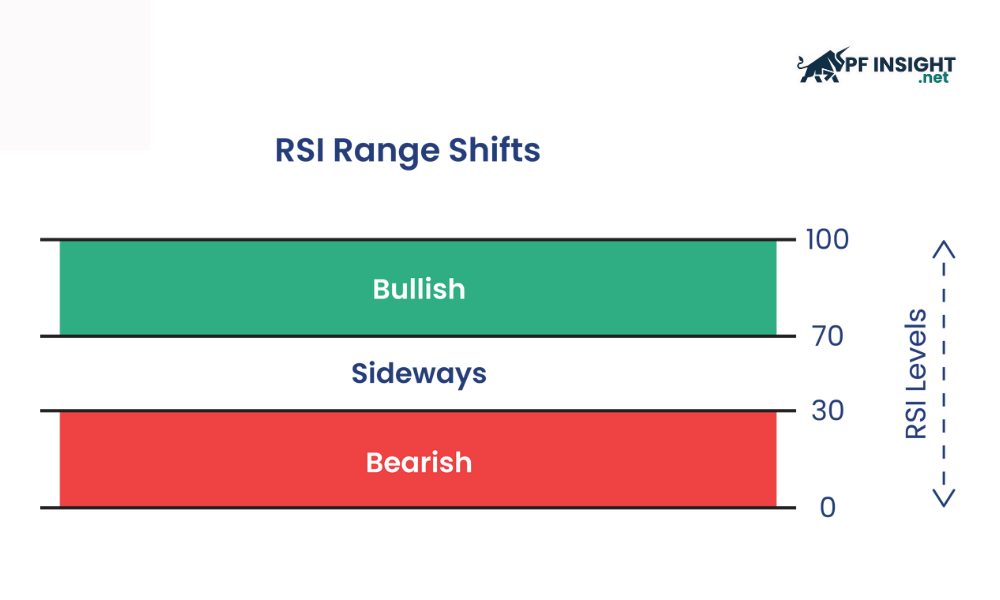
RSI is widely used in Mean Reversion trading to measure the speed and magnitude of price changes. With a scale of 0–100, this indicator helps identify when prices have moved too far and are likely to correct. Specifically:
- RSI above 70: Indicates that the asset is in an overbought state, increasing the likelihood of a price correction in the near future.
- RSI below 30: Indicates that the asset is oversold, thus opening up the possibility of a price recovery and upward correction.
Applying RSI allows for the identification of average reversal signals, helping to predict the likelihood of price corrections and a return to historical price levels.
Stochastic Oscillator
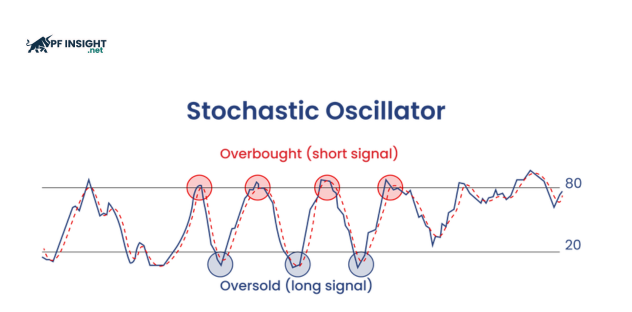
The Stochastic Oscillator is a momentum indicator used to assess the position of the closing price relative to the price range of an asset over a given period.
- A value above 80: Indicates that the asset may be overbought, increasing the likelihood of a price correction and a return to the average level.
- A value below 20: Reflects that the asset is in an oversold state, signaling the possibility of an upward correction and a return to equilibrium.
Through momentum analysis, the Stochastic Oscillator helps identify periods of price weakness within a trend, where the likelihood of a reversal and a return to the average becomes clearer.
MACD (Moving average convergence divergence)
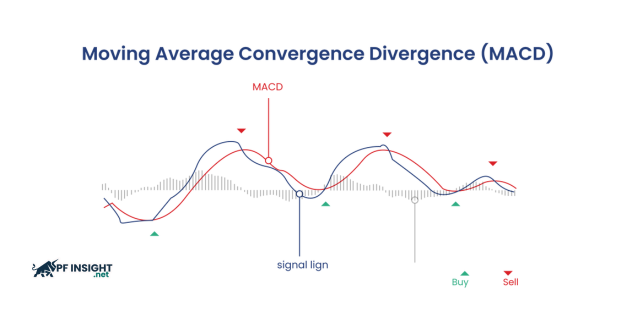
MACD is a trend-following momentum indicator that reflects the relationship between two exponential moving averages of price, typically the EMA 12 and EMA 26. Specifically:
- MACD crossing above the signal line: Indicates that upward momentum is forming, increasing the likelihood of a price reversal and a return to the average zone.
- MACD crossing below the signal line: This reflects a predominance of bearish momentum, warning of a potential price reversal to the average level.
MACD supports Mean Reversion trading by analyzing the strength, direction, and rhythm of trend movement. Changes in these factors are often early signals that the price may reverse and retrace to the average range.
3 popular Mean Reversion strategies
Mean Reversion trading is based on the principle that asset prices tend to return to their historical average after periods of significant volatility. This strategy allows traders to take advantage of overvalued or undervalued situations to buy low and sell high. Thanks to its flexibility, Mean Reversion trading can be effectively applied to many markets such as stocks, Forex, commodities, and financial indices.
Intraday Mean Reversion trading strategy
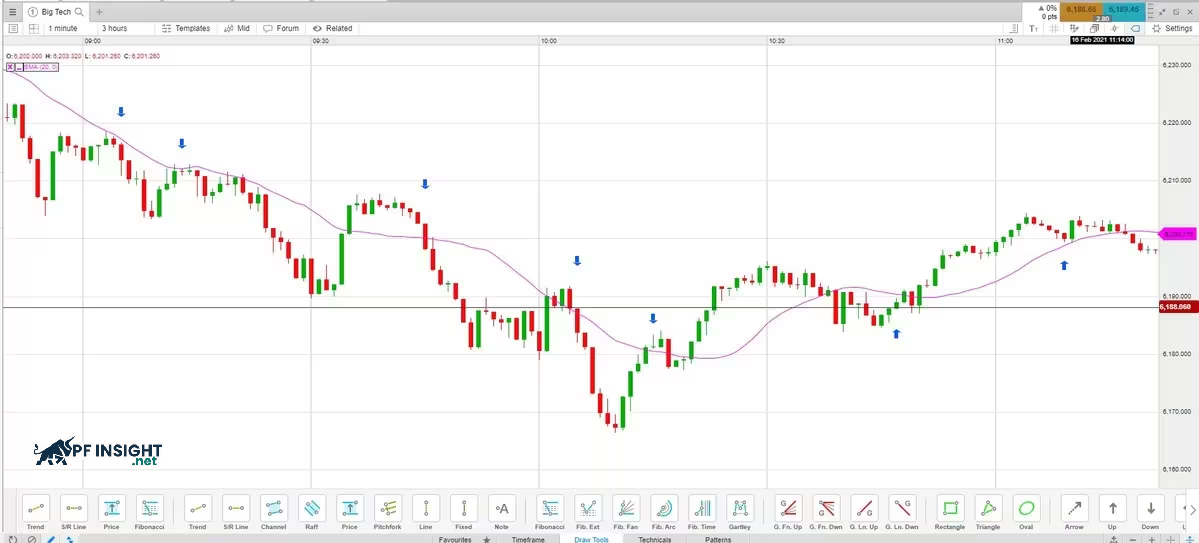
Day trading strategies involve buying and selling assets continuously throughout the day to exploit short-term volatility. Because positions are not held overnight, many traders use moving averages to identify points where prices retrace to equilibrium.
In an uptrend, prices typically fluctuate around the moving average, bouncing up before correcting back to the equilibrium zone. When prices return near the average while the trend remains intact, this can be a good time to look for buying opportunities. Conversely, in a downtrend, prices often fall below the average before rebounding. When prices approach the average zone, traders may consider selling opportunities.
For example, observing a one-minute chart of a basket of technology stocks, you can see that prices fluctuate continuously around the average. While not every fluctuation is an accurate prediction, many traders still use the moving average to guide their trades towards the prevailing trend.
Percentage price oscillator (PPO) strategy
Mean Reversion trading often incorporates PPO to assess price momentum through the percentage difference between two moving averages. This indicator helps traders detect overbought or oversold conditions, thereby identifying potential reversal points towards equilibrium.
Unusually high or low PPO values indicate that the asset price has moved too far from equilibrium. According to the average regression principle, these periods are often accompanied by the potential for a short-term reversal.
The Mean Reversion trading strategy with PPO allows traders to find selling points when the price rises too far from the equilibrium level and begins to weaken. When the PPO signals a reversal, a sell order can be triggered with the target at the average. Placing a stop loss above the entry point helps control risk if the price continues to move against expectations. Similarly, buying opportunities arise when the price falls sharply and shows signs of recovery.
Mean Reversion in pairs trading
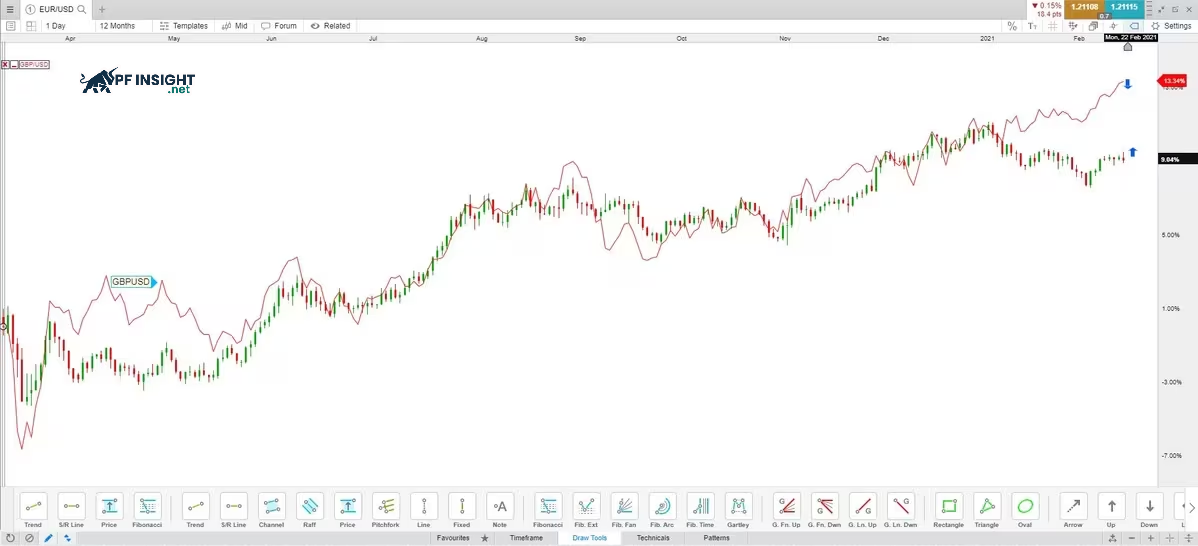
Pair trading focuses on identifying two assets that are strongly correlated and often move together. When an unusual divergence occurs between the two assets, the market may correct to restore the original relationship. This is the basis for building an average regression strategy, also known as statistical spread trading.
For example, EUR/USD and GBP/USD are two currency pairs that tend to move in the same direction due to similar economic fundamentals. However, at the bottom of the chart, GBP/USD (red line) rises while EUR/USD (candlestick chart) falls. According to Mean Reversion trading, this divergence is likely to narrow as the market brings the two pairs back to equilibrium.
The essence of pair trading is to take advantage of the relative difference between two assets by buying one and selling the other. Therefore, traders need to adjust the position size based on the volatility of each asset, also known as the hedging ratio.
If asset A has an average daily volatility of 1% and asset B has a volatility of approximately 2% per day, then the position in asset B should be reduced to half that of asset A. This reflects the fact that the more volatile asset requires less capital to generate a comparable return, while also allowing for more effective overall risk management.
Advantages and disadvantages of Mean Reversion trading
Mean Reversion trading helps traders build well-structured and adaptable strategies. However, this method is quite sensitive to market conditions and can incur significant transaction costs if not properly managed. Below are the advantages and disadvantages of Mean Reversion that traders should be aware of when trading:
Advantage
- Signal confirmation: Many technical indicators, as discussed previously, can be used to confirm retracement points to the moving average, thereby enhancing the reliability of the strategy.
- Profit potential: A moving average regression strategy can generate effective profits in sideways markets, where other trend-following methods are often less effective.
- A systematic approach: Mean Reversion trading provides a structured trading framework, making it easier for traders to identify entry and exit points.
- Risk management: Mean Reversion trading allows you to set stop-loss and take-profit levels around the average price, helping to minimize risk and protect capital.
- Flexibility: This strategy can be applied to a wide range of asset types and timeframes, from day trading to long-term trading.
Disadvantages
- Market conditions: Mean Reversion trading is often less effective in strongly trending markets, where prices can remain significantly off the average for extended periods.
- False signals: Using short timeframes increases the likelihood of market noise, leading to false reversal signals and increasing risk in Mean Reversion trading.
- Transaction costs: Because this strategy requires executing many orders in a short period of time, transaction costs may be higher compared to other methods.
- Lack of trend direction: Unlike trend-following strategies, the moving average regression strategy does not provide a clear market direction, so it may not be suitable for all trading styles.
- Economic events: Unexpected shocks or significant economic news can disrupt the regression model towards the mean value, leading to the risk of large losses.
Conclude
Mean Reversion trading provides a structured trading method that helps investors identify opportunities to buy low and sell high based on a trend returning to the average level. However, this strategy requires tight risk management and an understanding of market conditions to optimize its effectiveness.


