The Ichimoku cloud is considered one of the most comprehensive technical analysis tools, allowing traders to observe trends, momentum, and key price zones on a single chart. With its clear and easily recognizable structure, the Ichimoku cloud helps identify the dominant trend as well as potential entry points. In this article, PF Insight will help you understand more deeply how to apply the Ichimoku cloud indicator in real-world trading.
What is the Ichimoku cloud?
The Ichimoku cloud, also known as Ichimoku Kinko Hyo, is a comprehensive technical indicator that helps traders identify support and resistance zones, recognize trends, and assess market momentum. The term Ichimoku Kinko Hyo means “balanced chart in one view,” accurately reflecting the nature of this indicator. By simply observing the chart, traders can grasp the main trend and potential trading opportunities.
The Ichimoku cloud is the result of research by Goichi Hosoda, a Japanese journalist, before World War II. He believed that traditional charts had many limitations in reflecting the true trends of the market. Therefore, Hosoda developed a new trading system that focuses on equilibrium points and trends through a combination of multiple timeframes.
After nearly 30 years of research, the Ichimoku cloud was introduced by Hosoda through his book “Ichimoku Kinko Hyo” in 1968. Thanks to its high applicability, this book quickly became popular in Japan and became a standard analytical tool in trading.
Structure of the Ichimoku cloud indicator
Based on the principle of moving averages, the Ichimoku cloud not only reflects trends but also provides deeper insights into the market. Compared to traditional candlestick charts, this system adds data on time and price trends, helping traders observe potential price action more comprehensively and clearly.
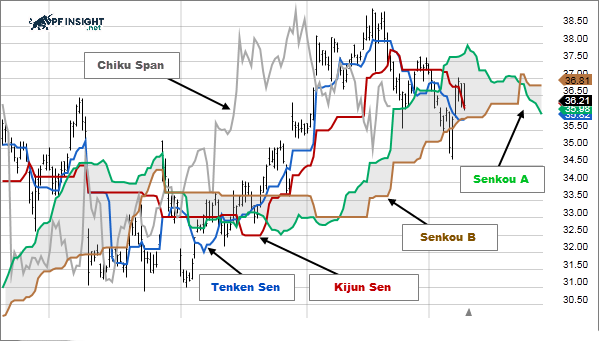
The Ichimoku cloud system consists of 5 main lines, representing different aspects of price action. All lines are drawn directly on the chart and calculated based on past price data. Specifically:
Tenkan-Sen (Conversion line)
The Tenkan-Sen is an indicator line that reflects the average of the highest and lowest prices over the last 9 trading sessions. This line is often used to assess short-term market trends. When the price remains above the Tenkan-Sen, the short-term uptrend is strengthened; conversely, when the price is below the Tenkan-Sen, it indicates that downward pressure is prevailing.
Calculation formula: (Highest high + Lowest low) / 2 (last 9 periods).
Kijun-Sen (Base line)
Similar to Tenkan-Sen, Kijun-Sen uses an average formula but with a longer period, usually 26 periods. This indicator reflects the medium-term trend of the market and is used by many traders as a dynamic support or resistance level.
Calculation formula: (Highest high + Lowest low) / 2 (Last 26 periods).
Senkou span A (Leading span A)
Senkou Span A is calculated by averaging the Tenkan-Sen and Kijun-Sen values, then shifting them forward by 26 periods. This line serves as one of the two main boundaries that make up the Ichimoku Cloud, helping to forecast future support and resistance zones.
Calculation formula: (Tenkan-Sen + Kijun-Sen) / 2
Senkou span B (Leading span B)
The Senkou Span B is calculated as the average of the highest and lowest prices over the last 52 periods, then shifted forward by 26 periods. This line forms the remaining boundary of the Ichimoku Cloud, helping to identify long-term support and resistance zones.
Calculation formula: (Highest high + Lowest low) / 2 (Last 52 periods).
Chikou span (Lagging span)
The Chikou Span represents the current closing price but shifted back 26 periods on the chart. This component is often used as a momentum indicator, helping traders assess the strength of the current trend and detect potential reversal signals early.
Meaning of the Ichimoku Kinko Hyo indicator

The Ichimoku cloud is a versatile indicator system that allows traders to analyze market trends, identify support and resistance zones, and find trading signals. Depending on how the components are combined, Ichimoku can be interpreted in various ways, including:
- Trend confirmation: The market is considered bullish when the price trades above the Ichimoku cloud and bearish when the price is below it. If the price moves inside the cloud, the market is usually in a sideways or consolidation phase.
- Trend strength: The strength of a trend in the Ichimoku cloud can be assessed through the cloud’s thickness. As the cloud expands and thickens, support or resistance zones become more solid, reflecting a strong ongoing trend. Conversely, a thin cloud generally indicates a weaker and less stable trend.
- Support and resistance zones: The two boundaries of the Ichimoku cloud act as dynamic support and resistance zones, constantly changing with market developments. As the cloud moves, these levels adjust accordingly, helping traders identify areas where price is likely to react, bounce back, or reverse.
- Buy and sell signals: In the Ichimoku system, a buy signal appears when the Tenkan-Sen crosses above the Kijun-Sen, indicating that upward momentum is forming. Conversely, a Tenkan-Sen crossing below the Kijun-Sen usually signals a sell signal. Additionally, when the Chikou Span crosses above the price line, the market tends to be uptrending; while when the Chikou Span crosses below the price line, a bearish signal is confirmed.
- Trend reversal: Ichimoku identifies trend reversals through the crossover of two Senkou Span lines. The changing cloud color reflects a shift in market structure. If Senkou Span A moves above Senkou Span B, the market turns into an uptrend; conversely, when Senkou Span A is below Senkou Span B, a downtrend is confirmed.
Advantages and disadvantages of Ichimoku cloud
Advantages of Ichimoku cloud
Ichimoku cloud is a versatile technical analysis system that offers many practical benefits to traders in reading trends and identifying potential trading opportunities.
- Overall market analysis: The Ichimoku cloud helps traders assess trends, their strength, support and resistance levels, and potential buy/sell signals all on a single chart.
- Intuitive and accessible: The Ichimoku cloud structure on the chart allows traders to visually assess market conditions and make quicker decisions.
- Diversified strategies: Ichimoku cloud allows traders to deploy strategies across multiple timeframes and trading products, making it easy to adjust to suit their individual trading style.
Disadvantages of the Ichimoku cloud
Despite its valuable insights into trend analysis, the Ichimoku cloud has limitations that need to be considered before application.
- Signal lag: Because it is built from past price data, the Ichimoku cloud can react slowly to strong fluctuations, leading to the risk of late or inaccurate signals.
- User dependence: Due to its interpretive nature, the Ichimoku cloud can generate different assessments among traders, increasing the risk of biased decisions.
- High complexity: The Ichimoku cloud comprises numerous components and calculation formulas, making it more challenging to initially understand compared to other simpler technical indicators.
How to apply Ichimoku cloud in real trading
When the Tenkan-Sen crosses the Kijun-Sen
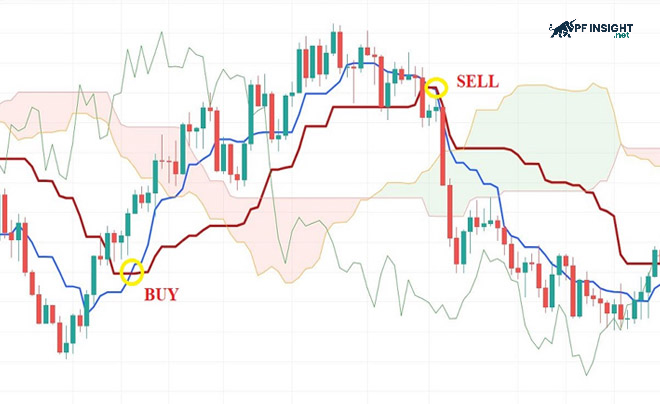
The crossover between the Tenkan-Sen (conversion line) and the Kijun-Sen (base line) provides an important signal that helps traders identify market trends, thereby selecting suitable Buy or Sell entry points in line with the prevailing trend.
- Buy: Tenkan-Sen crosses above Kijun-Sen, with the intersection point located below the Kumo cloud.
- Sell: Tenkan-Sen crosses below Kijun-Sen, with the crossover appearing above the Kumo cloud.
- Entry: Place orders based on candlestick signals: bullish candlesticks for Buy orders and bearish candlesticks for Sell orders.
- Stop loss: The stop loss is placed below the entry zone for Buy orders and above the entry zone for Sell orders.
- Take profit: Determined based on the expected profit/risk ratio.
When the Chikou Span crosses the price
When the Chikou Span line crosses above the price, it typically signals a potential shift in market momentum and helps traders confirm a clearer trend direction.
- Buy: When the Chikou Span crosses above the price line from below and then separates from the price, the bullish signal is strengthened.
- Sell: If the Chikou Span crosses the price line in a downward direction and quickly creates a gap with the price, the downtrend is likely confirmed.
- Entry: Traders look for confirmation candles near the Chikou Span crossover point, where a green candle is for a Buy order and a red candle is for a Sell order.
- Stop loss: Place it below the crossover area, near the highest support zone for a Buy order, and above the crossover area, near the highest resistance zone for a Sell order.
- Take profit: Determined based on the expected profit/risk ratio.
When Senkou Span A and Senkou Span B cross each other
These two lines are the core components of the Kumo cloud, and the crossover signals between them are often used to identify effective buy or sell opportunities.
- Buy: Senkou Span A crosses above Senkou Span B, causing the Kumo cloud to change from red to green.
- Sell: Senkou Span A crosses below Senkou Span B, causing the Kumo cloud to change from green to red.
- Entry: A Buy order is executed at the green candle near the crossover point, while a Sell order is executed at the bearish signal candle located close to the crossover area.
- Stop loss: Place it below the crossover zone, coinciding with or near the nearest support line for a Buy order; and above the crossover zone, close to the resistance line for a Sell order.
- Take profit: Determined based on the expected profit/risk ratio.
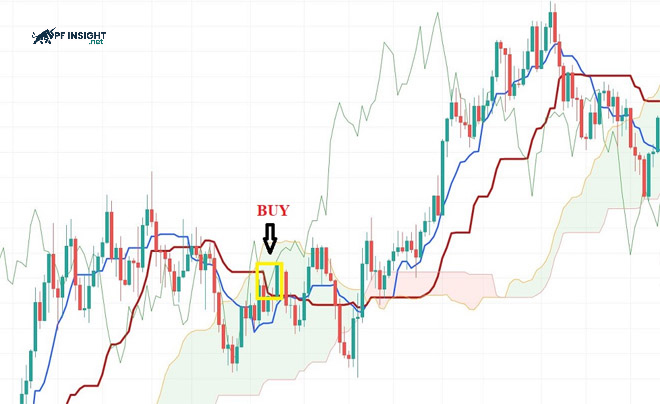
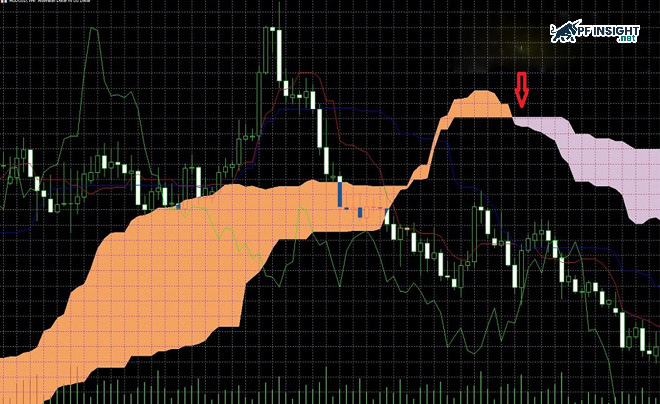
When the price breaks out of the Kumo cloud
Trading using breakout strategies carries significant risk, but when successful, the potential profits are very attractive. This strategy is suitable for investors with solid experience.
- Buy: The main trend remains downward but is showing signs of weakening. The price broke through the Ichimoku cloud from below and closed above the cloud, signaling a potential upward reversal.
- Sell: The main trend remains upward but is showing signs of weakening. The price broke through the Ichimoku cloud from above and closed below the cloud, signaling a potential reversal to the downside.
- Entry: Execute the order at the signal candle immediately after the breakout.
- Stop loss: For a Buy order, the stop loss level is below the A-B crossover zone; for a Sell order, the stop loss level is above the crossover zone.
- Take profit: Determined based on the expected profit/risk ratio.
Ichimoku cloud with MACD
Combining the Ichimoku cloud and MACD helps traders confirm the main trend and identify potential reversal points. When the MACD diverges from the Ichimoku signal, it provides an early indication of momentum changes. Simultaneously, when the MACD line crosses above the signal line just before or during the confirmation of an Ichimoku bullish signal, the uptrend is strengthened, creating a safer basis for entering trades.
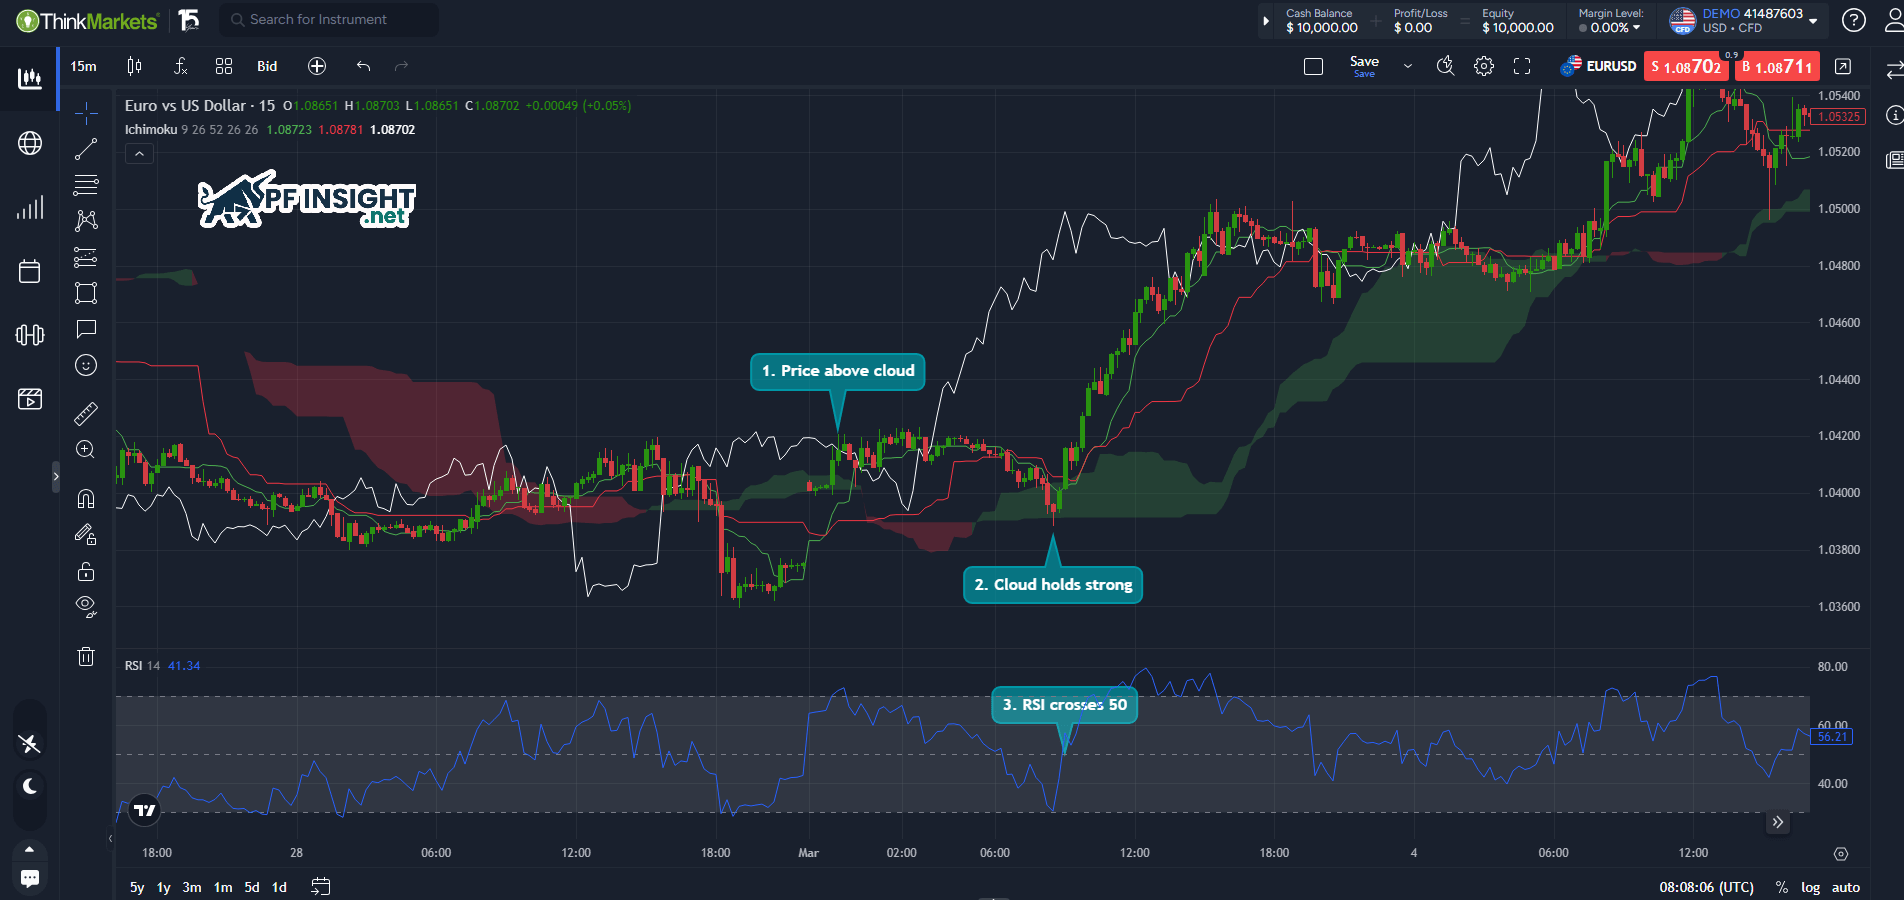
Ichimoku cloud with RSI
The combination of the Ichimoku cloud and RSI enhances the reliability of trend identification. When the price remains above the Ichimoku cloud and the Tenkan Sen and Kijun Sen lines act as strong support, the buy signal is strengthened. Specifically, the RSI exceeding 50 indicates strong upward momentum, providing the necessary confirmation for traders to confidently open buy positions in the market.
See more: Stochastic oscillator simple methods beginners can apply
Things to note when using the Ichimoku cloud
The Ichimoku cloud is a powerful analytical system, but its complexity sometimes leads investors to make mistakes. Below are four common mistakes and solutions to help you make more accurate trading decisions.

Applying a timeframe that is too short
Many investors make the mistake of using the Ichimoku cloud on short timeframes like M15, M30, or H1. On these timeframes, prices fluctuate very quickly, easily generating false signals and leading to inaccurate trades. To avoid false signals, traders should use Ichimoku on longer timeframes, such as Daily or Weekly. Longer timeframes help to identify the overall trend and make more accurate trading decisions.
Enter the trade while the price is still within the Ichimoku cloud
Many traders often try to enter Buy or Sell orders when the price is still within the Ichimoku cloud. However, when the price is within the cloud, the market often lacks a clear trend and volatility is difficult to predict, making the signal weak and trading feel like “gambling.” The solution is to patiently wait for the price to clearly break out of the cloud, confirming a new trend before executing an order, which reduces risk and increases the reliability of the trading decision.
Making decisions based on a single signal
New traders often only pay attention to the Tenkan-Sen crossing the Kijun-Sen, overlooking other factors. The Ichimoku cloud consists of five components, so relying on a single signal will not reflect the entire market picture. To overcome this, multiple signals need to be combined: checking if the price is above the cloud, the color of the cloud ahead, and the position of the Chikou Span to confirm the trend, thereby making more accurate trading decisions.
Do not combine Ichimoku with other technical tools
Although Ichimoku Kinko Hyo is a powerful analytical tool, it should not be used alone. Relying solely on the Ichimoku cloud can lead to false signals, increasing trading risk. The solution is to combine it with other tools to confirm signals, for example, RSI to assess overbought or oversold conditions, or MACD to measure trend strength. This helps filter out false signals, improving reliability and the success rate of trades.
Conclude
The Ichimoku cloud is a comprehensive technical analysis tool covering everything from trends to trading signals. Effectively using this tool requires combining many factors, thorough analysis, and patience, which helps traders make accurate decisions and enhance long-term success.


