The Relative Strength Index, commonly referred to as the RSI indicator, is one of the most widely used momentum tools in technical analysis. Thanks to its simple structure and clear scale ranging from 0 to 100, RSI is especially appealing to new traders.
However, this simplicity often leads beginners to misunderstand how RSI actually works. Instead of viewing RSI as a tool that measures the strength of price movement, many beginners treat RSI levels as direct buy or sell signals. This approach often creates unrealistic expectations and generates excessive noise during trading.
This article will analyze the most common mistakes beginners make when using the RSI indicator, explain why these errors occur, and show how traders can reduce false signals in real trading conditions.
- Scalping trading strategies best indicators and timeframes for short trades
- How to add custom indicators to MT5: step-by-step setup guide (2025 update)
- The secret to applying Mean Reversion strategy for Prop Firm to easily pass the Challenge
What Is the RSI Indicator (Relative Strength Index)?
The Relative Strength Index (RSI) is a momentum indicator used in technical analysis to measure the speed and magnitude of price changes over a specific period. It helps traders assess whether current price momentum is strong or weak, allowing them to identify overbought or oversold market conditions.
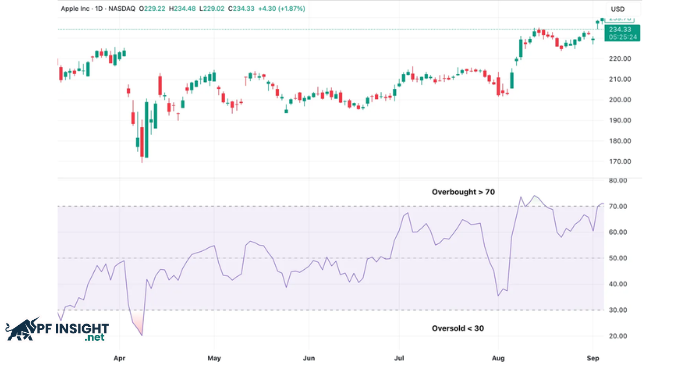
RSI is displayed as an oscillator that moves between 0 and 100. In traditional usage, when RSI is above 70, the market is considered overbought. When RSI falls below 30, the market is considered oversold. These levels do not indicate that price will reverse immediately; instead, they reflect how stretched momentum is relative to recent price movements.
The RSI indicator was developed by J. Welles Wilder Jr. and was first introduced in 1978. To this day, RSI remains one of the most widely used technical indicators and is built into nearly all modern trading platforms.
How the RSI works
RSI works by measuring price momentum through a comparison of price gains and losses over a specific period, most commonly 14 periods. The result of this comparison is normalized into a value that fluctuates between 0 and 100, reflecting the strength or weakness of current momentum. Specifically, RSI reflects the following dynamics:
- When price rises with strong and consistent momentum, RSI tends to move higher.
- When price falls with strong momentum, RSI moves lower.
- RSI fluctuates within a fixed range from 0 to 100, allowing traders to easily compare different momentum conditions.
- In strongly trending markets, RSI can remain in overbought or oversold territory for an extended period of time.
Because RSI focuses on momentum rather than predicting price direction, it is not designed to pinpoint exact reversal points. Instead, RSI helps traders assess the momentum context of the market to support better trading decisions.
Why beginners struggle with the RSI indicator
Beginners often struggle when using the RSI indicator because they do not clearly understand its true role in technical analysis. RSI is designed to measure momentum, but many beginners expect it to function as a tool that precisely predicts reversal points. Some common reasons why beginners tend to misuse RSI include:
- Confusing overbought and oversold conditions with immediate buy or sell signals.
- Failing to distinguish between trending markets and ranging markets.
- Using RSI as a standalone indicator without considering price context or the broader trend.
- Expecting RSI to react quickly and accurately in all market conditions.
These misunderstandings often cause beginners to enter trades too early, exit positions too quickly, or repeatedly encounter false signals, especially during strong trending market phases.
Common RSI indicator errors beginners often overlook
Most mistakes when using the RSI indicator do not come from the tool itself but from how beginners understand and apply it. When RSI is treated as a standalone buy or sell signal instead of a momentum indicator, trading decisions often lack context and produce misleading signals.
Treating overbought and oversold levels as guaranteed reversals
One of the most common misconceptions is believing that RSI above 70 means price is about to fall, or RSI below 30 means price is about to rise. In reality, overbought and oversold levels only reflect strong current momentum, not a guaranteed reversal.
In clearly trending markets, RSI can remain overbought or oversold for an extended period. Entering trades solely based on these levels often leads traders to trade against the trend and take unnecessary risk.
Applying the same RSI rules in all market conditions
RSI does not behave the same way in every market environment. It tends to work better in ranging markets, where price moves within a defined range.
When the market enters a strong trend, traditional RSI rules often generate noisy signals. Beginners frequently fail to adjust how they interpret RSI based on market context, leading to rigid and inaccurate application.
Using RSI signals against the primary trend
Another serious mistake is looking for buy signals when RSI is oversold in a strong downtrend or sell signals when RSI is overbought in a strong uptrend. Counter-trend RSI signals usually have a low probability of success and are easily invalidated.
RSI is designed to help assess momentum, not to consistently catch market tops or bottoms.
Ignoring price structure and market context
RSI does not exist independently from price action. When traders ignore market structure, support and resistance zones, or overall trend context, they tend to overestimate the value of a single RSI signal.
In many cases, RSI serves as confirmation of what price action already shows, rather than being the primary driver of trading decisions.
Overreacting to minor RSI fluctuations
Not every movement in RSI has trading significance. Small fluctuations around the neutral zone often reflect market noise rather than meaningful momentum changes.
Beginners frequently overreact to these minor moves, leading to overtrading and reduced overall strategy performance.
Relying on a single timeframe RSI
Looking at RSI on only one timeframe can cause traders to misinterpret the broader momentum context. RSI on a lower timeframe may produce signals that directly contradict higher timeframe momentum.
Failing to compare multiple timeframes makes trading decisions less consistent and more vulnerable to short-term price fluctuations.
How to avoid these RSI mistakes as a beginner

Using the RSI indicator effectively does not depend on memorizing more signals. It depends on placing RSI in the correct role within the analysis process. When beginners understand the purpose and limitations of this indicator, they can significantly reduce false signals without changing the tool itself.
Reframing the role of RSI in technical analysis: RSI is not designed to predict where price will move next. Its primary function is to reflect the strength or weakness of momentum over a specific period. When RSI is used as a tool to assess market conditions rather than as a standalone decision system, noisy signals are greatly reduced.
Interpreting RSI within trend context: The meaning of RSI changes significantly depending on the market trend. In trending environments, RSI tends to operate within different ranges compared to ranging markets. Failing to place RSI within trend context makes overbought and oversold levels easy to misinterpret. Identifying the trend before interpreting RSI helps traders avoid rushed conclusions and countertrend trades.
Understanding flexible RSI ranges: The 70 and 30 levels are not fixed boundaries in all situations. In many cases, RSI forms its own operating ranges that reflect the characteristic momentum of the current trend. This flexible approach allows traders to view RSI as a momentum spectrum rather than a rigid set of levels.
Integrating RSI with price behavior: RSI has limited value when separated from price action. RSI signals become more meaningful when they align with changes in price structure or market reactions at key price zones. This integration allows RSI to act as a confirmation tool instead of the primary driver of trading decisions.
Evaluating RSI across multiple time horizons: Momentum does not exist on a single timeframe in isolation. RSI on a lower timeframe may reflect short-term fluctuations, while RSI on a higher timeframe represents the market’s core momentum. Comparing RSI across multiple timeframes helps traders better understand the broader context and avoid decisions based on unstable short-term signals.
Conclusion
The RSI indicator is a widely used momentum tool, but its role is often misunderstood by beginners. When RSI is treated as a standalone buy or sell signal, it tends to generate excessive noise and context-free decisions. Placing RSI in relation to trend direction and price action allows the indicator to reflect momentum more accurately. For beginners, understanding how RSI truly works is more important than searching for a perfect entry signal.
Follow PF Insight to continue exploring in-depth market analysis and trading insights, helping you better understand how to use technical tools like RSI effectively and consistently.


