In technical analysis, early detection of reversal signals helps optimize profits. The stochastic oscillator is one of the most important indicators, helping to identify overbought or oversold conditions in the market. This allows traders to make smarter trading decisions, minimize risks, and improve investment efficiency.
The stochastic oscillator is a momentum indicator that compares an asset’s closing price to a price range over the past 14 periods. This indicator helps traders identify reasonable buying and selling opportunities, minimizing market risk.
Stochastics, developed by George C. Lane in the 1950s, helps identify trend reversal points by indicating overbought and oversold conditions on a scale of 0–100. The indicator’s sensitivity can be adjusted across timeframes or moving averages.
Key components of the stochastic oscillator
The Stochastic oscillator is composed of two oscillating lines, %K and %D.
The stochastic oscillator assesses the position of the closing price relative to the price range over a period of time. It is represented by two oscillating lines, %K and %D, helping traders effectively detect reversal signals.
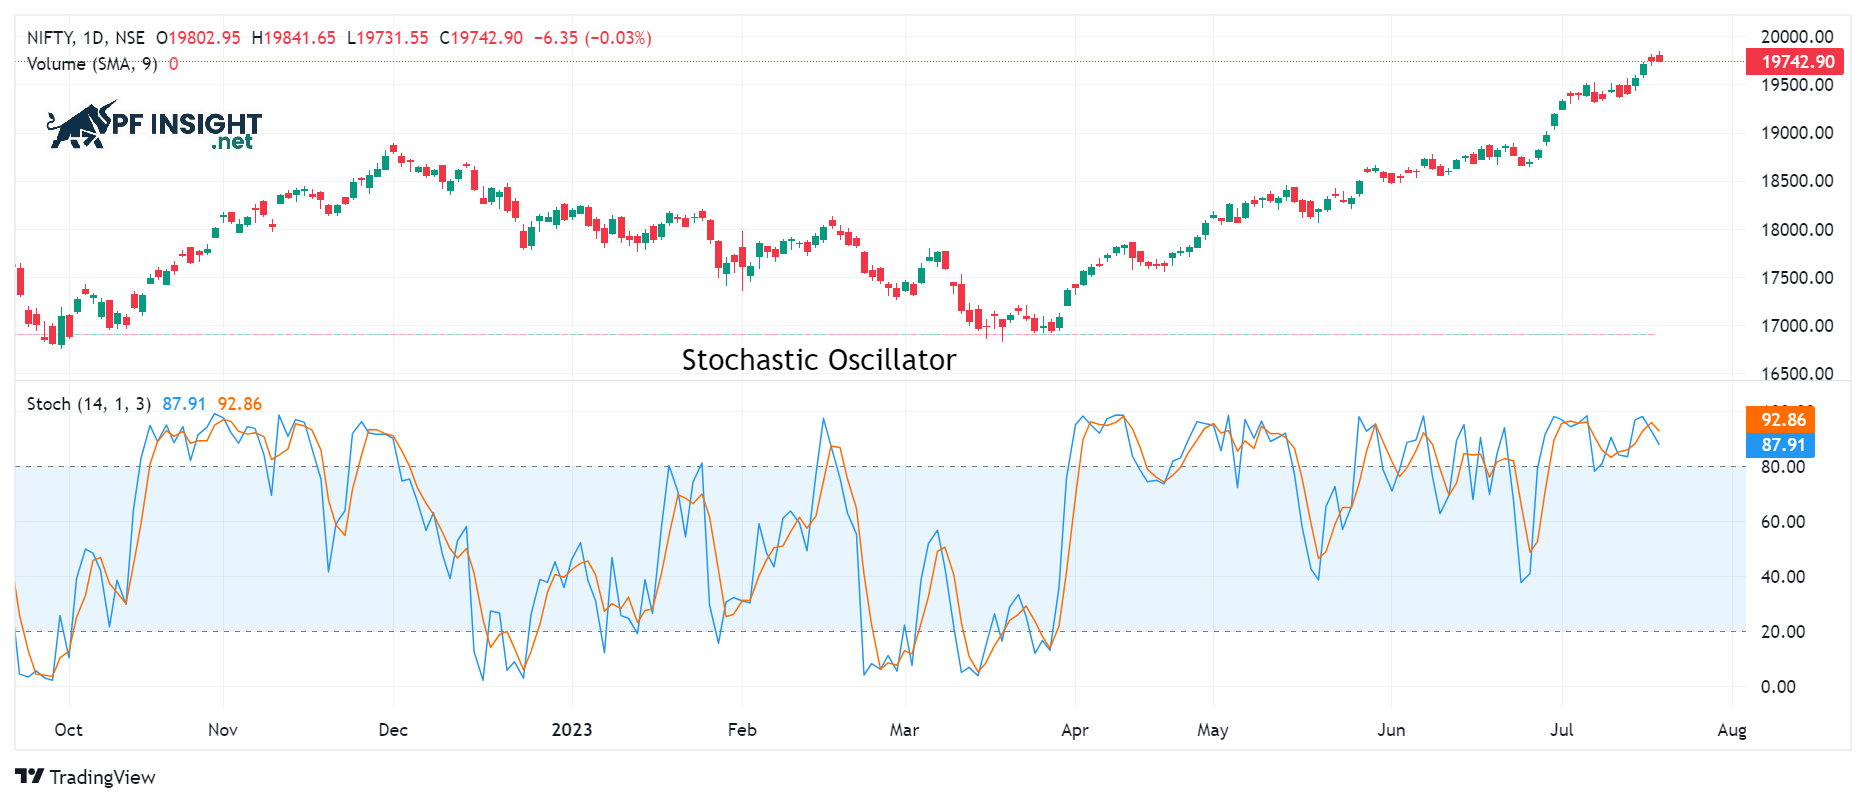
The %K line (blue): The main oscillator line, named stochastics by George C. Lane because it closely reflects the price range under consideration.
The %D line (orange): This is the 3-period moving average (SMA3) of %K, so it will lag behind %K and have a certain delay.
Boundary lines: The default boundary levels of the stochastic oscillator are typically 20 at the bottom and 80 at the top, helping to identify oversold and overbought areas.
A price above 80 indicates an overbought market, while a price above 20 indicates an oversold market. The %K line represents current price action, while %D is the SMA calculated from %K. Traders often rely on the quick signals of %K and the divergence of %D to identify overbought/oversold areas and important reversal signals.
How to calculate the stochastic indicator
Trading platforms often provide a stochastic oscillator, but understanding the formula is crucial for traders to grasp how it works. The indicator consists of %K and %D, with %K reflecting the current price and %D being the moving average from %K.
%K = [(C – L14) / (H14 – L14)] x 100
%K is the current value of stochastics.
C is the current closing price.
L14 is the lowest level in the last 14 periods.
H14 represents the highest level during that same period.
%D = (Current %K + Previous period %K + 2 previous periods %K) / 3
The default time period n is usually 14, but investors can choose any timeframe such as week, day, hour, 4 hours, or 5 minutes to analyze price. Smaller time periods allow stochastics to react quickly to fluctuations, but they are also more prone to generating false signals, so caution is needed when using them.
As n increases, the stochastic oscillator reacts more slowly to price fluctuations, but the signals become more reliable. At the same time, the %K line is always more sensitive than the %D line, which is the moving average of %K, helping traders detect trends earlier.
The significance of stochastic oscillators in trading
The Stochastic Oscillator is a technical indicator that helps traders identify reversal signals, divergences, and closely monitor price action. It is particularly useful in identifying overbought and oversold areas. Understanding the meaning of each Stochastic signal is crucial for investors.
Identifying overbought and oversold areas
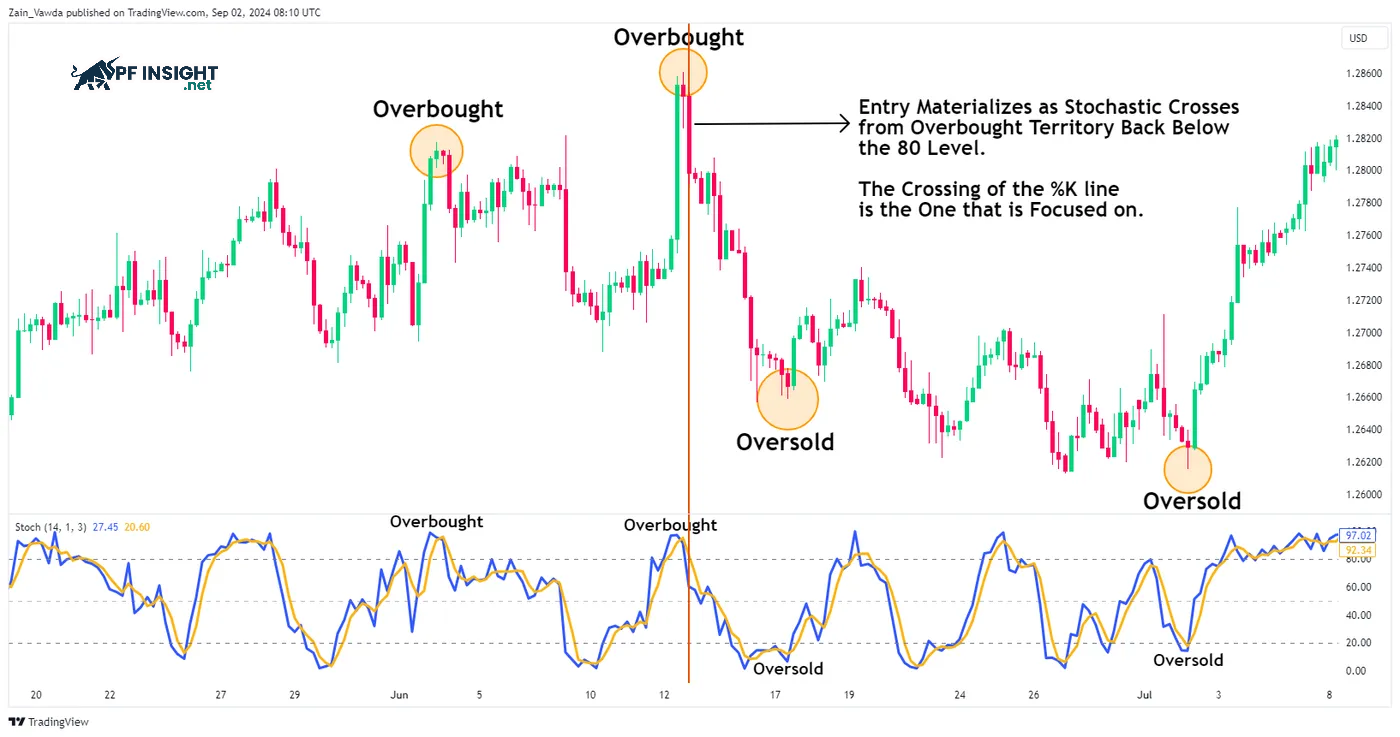
Stochastic Oscillator – Identifyes overbought and oversold areas.
When the stochastic oscillator crosses above 80, the market is considered overbought; below 20, it is oversold. A sell signal is formed when the indicator falls from above 80 to below 80, while a buy signal appears when the stochastic rises from below 20 to above 20. Overbought and oversold levels reflect whether the price is near the top or bottom of the chosen trading range, helping traders identify potential reversal points.
Divergence signal
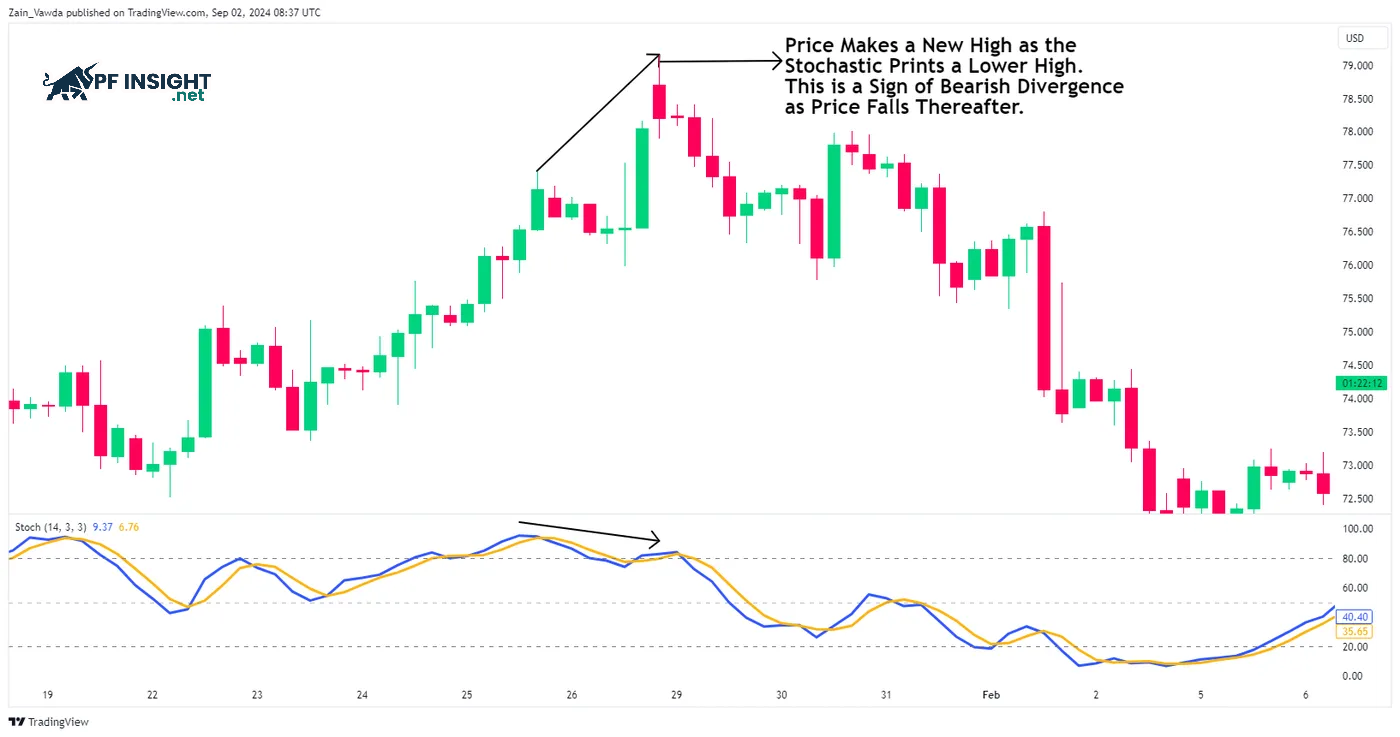
A bullish divergence occurs when the price falls to a new low but the stochastic oscillator does not create a corresponding low.
When the price creates new highs or lows that the stochastic oscillator fails to keep up, divergence occurs. For example, if the price rises to a new high but the indicator doesn’t rise accordingly, this is a bearish sign. This indicates that the uptrend is losing momentum, potentially leading to a market reversal.
A bullish divergence occurs when the price falls to a new low but the stochastic oscillator does not create a corresponding low. This is a sign that the market may reverse to an upward trend. Stochastic oscillators often provide early warnings, helping investors identify potential trend changes before prices actually fluctuate.
Crossover
A crossover occurs when the %K (fast Stochastic) line crosses the %D (slow Stochastic) line.
A crossover occurs when the %K (fast Stochastic) line crosses the %D (slow Stochastic) line. If %K rises above %D, it signals a bullish trend. Conversely, when %K crosses below %D, the market signals a bearish trend, helping traders identify timely buying and selling opportunities.
Effective trading strategies using the stochastic oscillator
Like many other indicators, the stochastic oscillator can be applied in various trading strategies. However, optimal effectiveness is achieved when combined with supplementary indicators or price action analysis, helping traders make more accurate decisions.
Stochastic oscillator with moving averages
Stochastic oscillator with moving averages
Combining the stochastic oscillator with moving averages creates an effective trading strategy. Moving averages help identify long-term trends and key support and resistance levels. This combination also supports multi-timeframe analysis, where the moving average reflects the overall market trend.
After identifying the long-term trend, traders can observe shorter timeframes to find potential entry points. The Stochastic oscillator helps detect reasonable buy and sell signals based on price movements.
The effectiveness of the strategy depends on trading in the direction indicated by the moving averages. Multi-timeframe analysis provides an overall view, helping traders identify reasonable entry opportunities. Specifically:
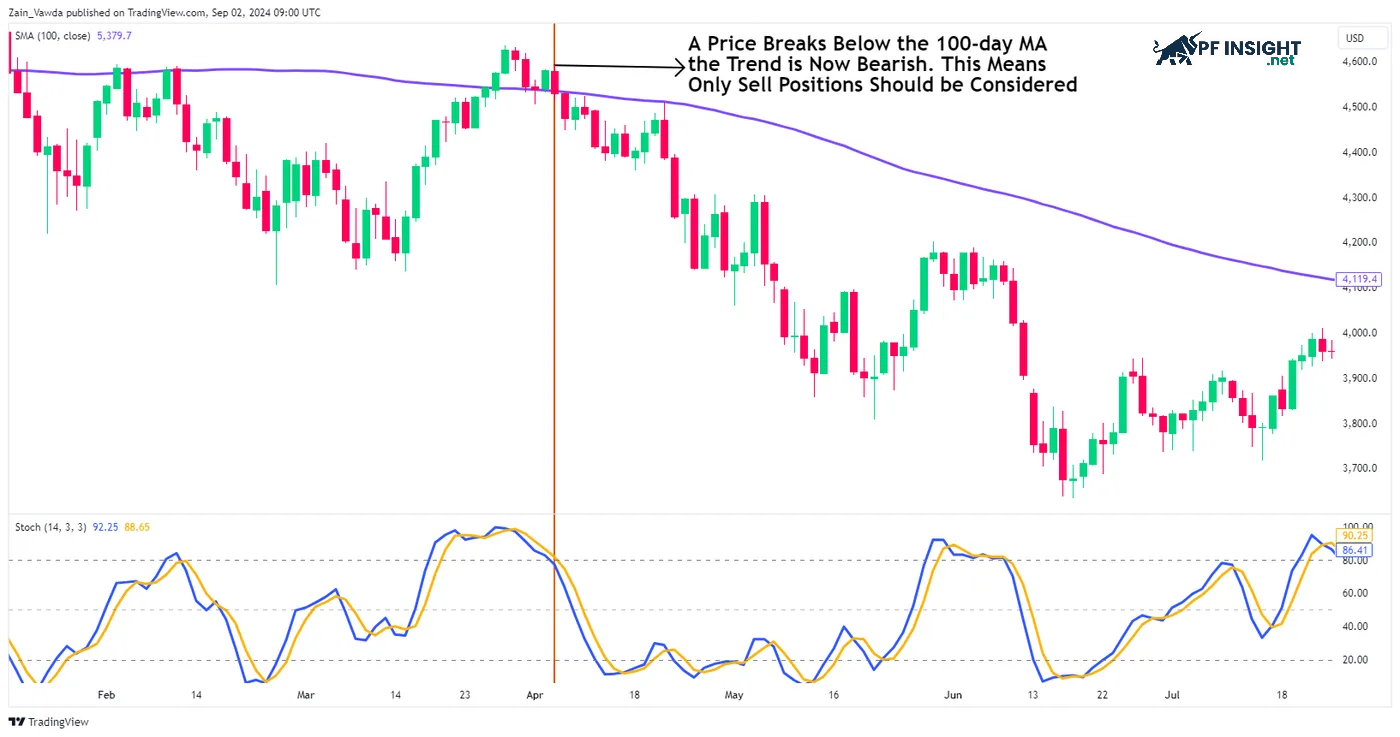
Step 1: Use the 100-day Simple Moving Average (SMA 100) on the daily chart to identify the trend. Price above the SMA 100 indicates an uptrend, while price below the SMA 100 indicates a downtrend, helping traders to accurately orient their trades.
Step 2: Observe the 2-hour (or 1-hour, 30-minute) chart to evaluate signals from the Stochastic indicator. Only execute trades if this signal aligns with the daily trend from Step 1; for example, in a downtrend, prioritize sell orders.
When the daily trend is identified as upward, only pay attention to buy signals when the stochastic oscillator crosses above 20. If the trend is downward, only consider sell orders when the stochastic oscillator falls below 80, helping to keep the trade aligned with the overall trend.
Stochastic oscillator with candlestick pattern
Stochastic oscillator with candlestick pattern
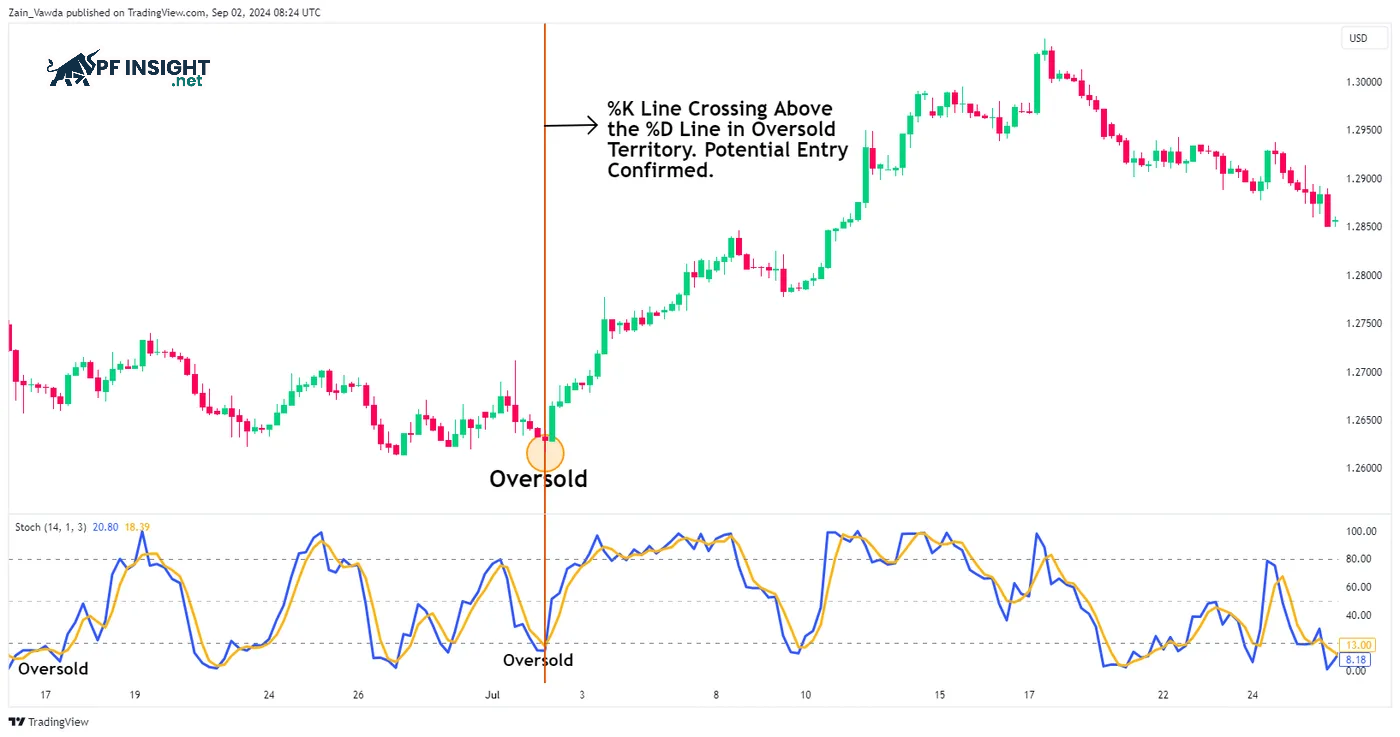
Using the stochastic oscillator along with candlestick patterns, this strategy helps traders identify effective trading opportunities. The stochastic oscillator provides buy and sell signals, while candlestick patterns detect potential changes in market trends, supporting more accurate decision-making.
This strategy begins by identifying overbought and oversold areas using the stochastic oscillator. When the indicator is above 80, the market is considered overbought; below 20, it is oversold. Traders then look for potential reversal signals through candlestick patterns, such as Hammer, Doji, or Engulfing, to identify optimal entry points, combining indicator signals and price action to improve the accuracy of their trading decisions.
This strategy is flexible and applicable to all timeframes and markets, but is more effective on daily charts. It is suitable for both short-term and long-term traders, as the signals from the strategy can support both swing trading and trend trading, helping to optimize entry and exit points.
Stochastic oscillator with RSI
Stochastic oscillator with RSI
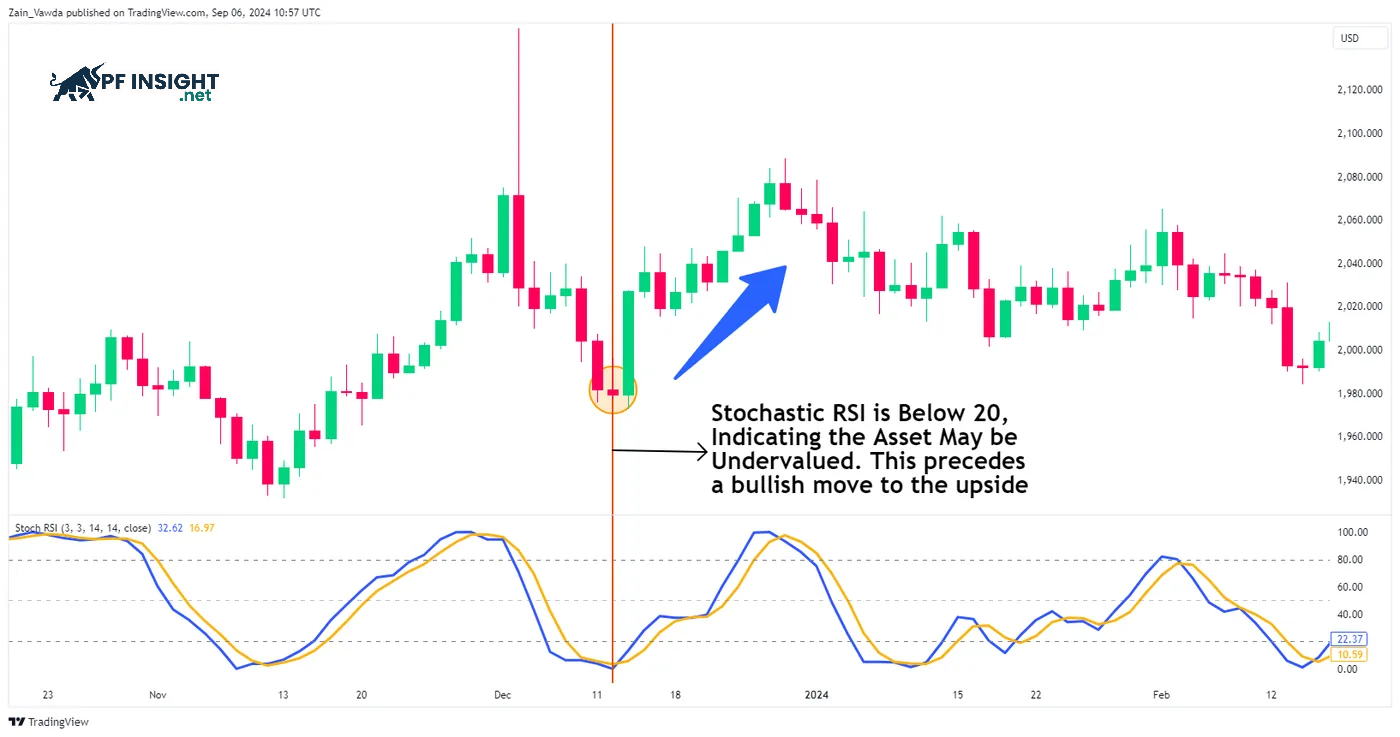
Stochastic RSI is a combination of stochastic and RSI, used to identify when an asset’s price becomes too high or too low. A stochastic RSI above 80 indicates excessive buying pressure and a potential price drop. Conversely, a reading below 20 suggests the asset may be undervalued and an upward price movement is imminent.
A drop in the Stochastic RSI below 20 indicates that the asset is significantly undervalued and may be on the verge of a rally. This is a warning sign of a buying opportunity. However, wise traders should not rely on a single indicator. To confirm the optimal buying time, they should combine this signal with other tools.
One limitation of the Stochastic RSI indicator is that it analyzes the RSI value as input, rather than directly relying on the actual market price of the asset. This can be problematic for traders who focus on price action, as they consider price to be the most accurate representation of market sentiment. The Stochastic RSI should only be considered a supporting tool to confirm or clarify signals, not the primary data source to negate the importance of price volatility.
This strategy is particularly effective because it integrates the Stochastic oscillator to assess market momentum, along with the use of Fibonacci levels to accurately identify potential reversal points. Fibonacci levels, which are a series of important percentage ratios, are applied to predict support and resistance zones where price is likely to react strongly. In this way, traders can identify entry points when the Stochastic oscillator gives a signal, while setting targets and stop losses based on Fibonacci levels.
In technical analysis, the Stochastic Oscillator is an oscillator used to detect reversal signals. When this indicator is below 20, it is generally interpreted as a clear sign that the market is oversold, suggesting a potential upward reversal. Conversely, if the indicator is above 80, it warns of an overbought market, signaling a potential downward correction.
When the Stochastic indicator is between 20 and 80, momentum is not very strong, suggesting a sideways or consolidating market. In this case, Fibonacci levels become the primary tool for traders to identify potential entry and exit points by looking for key price reaction levels.
Stochastic oscillator with trendline
Stochastic oscillator with trendline
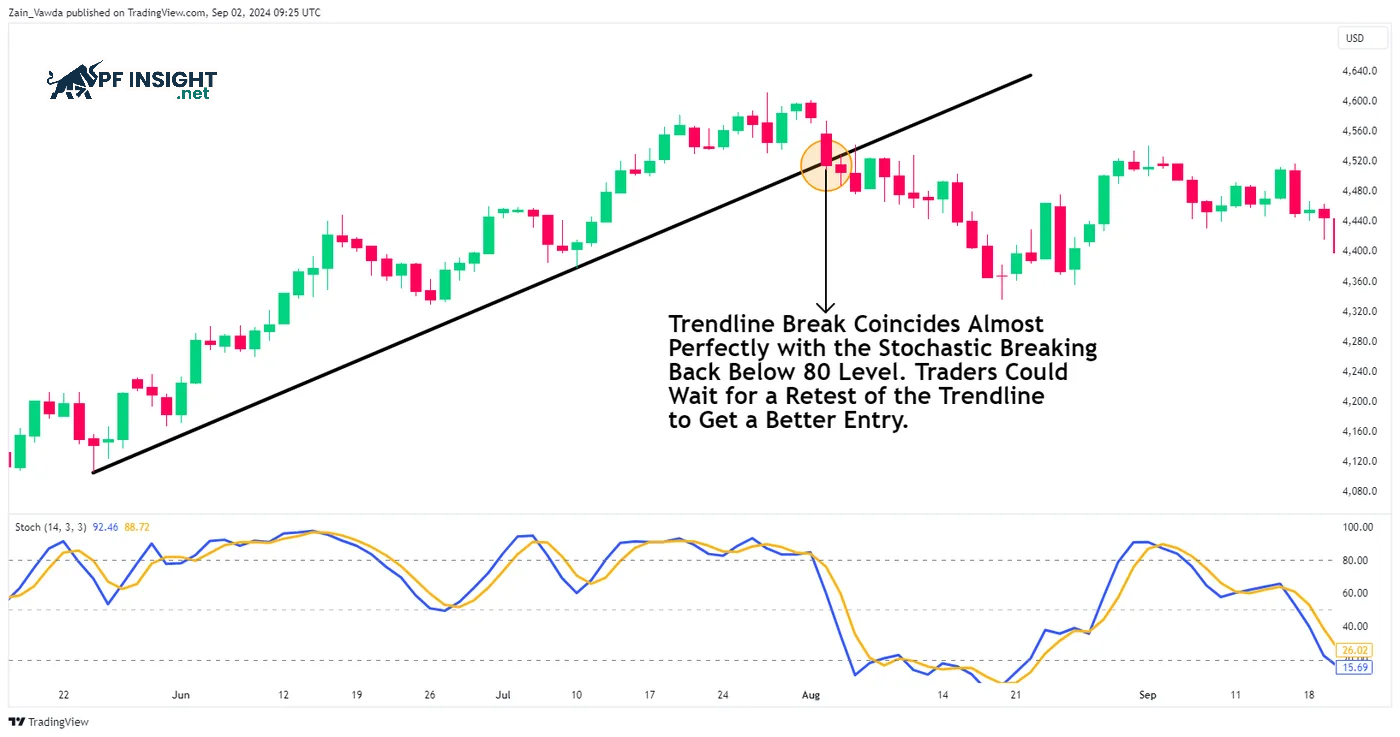
Divergence or reversals from the stochastic oscillator can be combined extremely effectively with trend lines and price action signals in trading strategies. Once a trend line has been clearly established, a buy or sell signal is triggered when that trend line is broken. If this breakout is simultaneously confirmed by the stochastic indicator, it creates a trading signal with significantly higher reliability and strength.
The example in the chart illustrates that the Stochastic indicator crosses below 80 (overbought zone) precisely at the moment the trendline is broken. However, in real-world trading, it’s crucial to recognize that such synchronization doesn’t always occur. Sometimes, the trendline breakout may happen first, and only then does the Stochastic indicator cross above 80, requiring traders to be flexible in interpreting the signal.
On the other hand, another common scenario is that the Stochastic indicator may cross below 80 before the trendline is actually broken by price. This reversal at this point does not invalidate the signal. Instead, it is simply another setup variation that the trader can utilize. In this case, the Stochastic provides the early signal, and the trendline breakout acts as later confirmation.
Important considerations when trading with stochastic
To maximize the effectiveness of the stochastic oscillator, traders need to pay attention to several key points in the analysis and decision-making process.
Prioritize larger timeframes: Stochastic oscillators should be used on larger timeframes for more accurate signals. Smaller timeframes tend to generate more noise and are more prone to false signals.
Combining with other tools: Although the stochastic oscillator helps identify short-term price movements, traders should still combine it with other indicators or supplementary analyses to confirm signals and reduce risk.
Stochastic anticipates price action: As a momentum indicator, the stochastic oscillator typically reacts earlier than price movements, helping to predict potential reversals or the market’s next direction.
Be cautious with reversals on lower timeframes: Reversal signals on smaller timeframes are often less accurate. New or inexperienced investors should limit trading in these situations to avoid high risk.
Conclude
Mastering the operation of the stochastic oscillator helps traders improve their ability to predict price movements and optimize entry points. However, this indicator is only truly effective when used in the right context and with additional confirmation tools. According to PF Insight, investors can build more robust strategies, maximizing the power of the stochastic oscillator.