Fibonacci retracement is one of the most widely used technical tools for identifying price zones where the market may pause, bounce, or continue following the prevailing trend. Originating from a mathematical concept, Fibonacci retracement has become popular in trading because of its ability to reflect market behavior through key price levels during a pullback.
In today’s article, PF Insight explains how Fibonacci retracement operates, starting from the basic concept before moving into real-world logic and how traders apply it in actual market conditions.
A technical analysis tool for determining the extent of a price correction within a trend is the Fibonacci retracement.
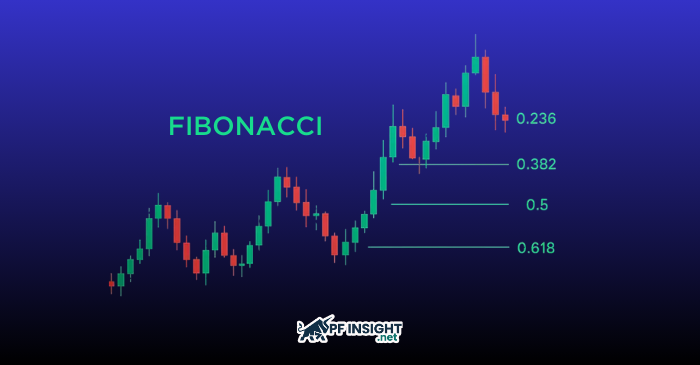
Fibonacci retracement is a technical analysis tool used to measure the depth of a price correction within a trend. It works by selecting two extreme points in the market, a swing high and a swing low, then dividing that price range into key percentage levels, typically 23.6%, 38.2%, 50%, 61.8%, and 78.6%.
These levels are viewed as zones where price reactions may occur during a temporary market pullback before the main trend continues. Instead of trying to predict the exact reversal point, Fibonacci retracement helps traders identify areas where buying or selling pressure is likely to return.
In practical trading, Fibonacci retracement is used to:
Measure the depth of a pullback
Identify temporary support or resistance zones
Support decisions on entry, stop loss, and target
With its ability to visualize important price zones within market structure, Fibonacci retracement has become an essential tool for both new and experienced traders.
What Fibonacci retracement levels are and why price reacts to them
Fibonacci retracement levels are percentage levels calculated from the price range between a swing high and a swing low. In technical analysis, the most common levels are 23.6%, 38.2%, 50%, 61.8%, and 78.6%. Each level represents a correction ratio that frequently appears within a trend before price continues moving in the main direction.
Although these levels originate from the Fibonacci sequence, their widespread use does not come from pure mathematics but from how the market reacts in real conditions. Fibonacci levels often align with areas where buying and selling forces are in balance, where traders tend to place pending orders, take profit, or expect a short-term reversal.
Price tends to react at Fibonacci levels for three main reasons:
Trader concentration
Most traders monitor the same common levels, such as 38.2%, 50%, and 61.8%. When many orders are triggered within the same zone, price often produces a noticeable reaction.
Market psychology during pullbacks
Pullbacks rarely occur in a straight line. The market typically pauses at high-liquidity zones, which Fibonacci retracement levels often mark with surprising accuracy.
Alignment with other technical areas
Fibonacci levels frequently coincide with:
Previous support or resistance
Trendlines
Moving averages
Supply and demand zones
This creates confluence and increases the probability of short-term price reactions.
By highlighting areas where the market is likely to pause or reverse, Fibonacci retracement levels provide an important foundation for traders to read price behavior and prepare for the next steps in real-world trading.
The logic behind Fibonacci in real trading: how traders interpret levels
Although Fibonacci retracement is viewed as a tool for measuring the depth of a correction, what matters in real trading is how traders interpret the meaning of each level. Fibonacci does not create price reactions; it is the market’s behavior and traders’ expectations that turn these levels into reference points for reading crowd psychology.
In practice, traders usually rely on three core logics when interpreting Fibonacci retracement:
Each Fibonacci level represents a different depth of the pullback and the strength of market momentum
The 38.2 percent level often reflects strong momentum. Price makes only a shallow correction before the main trend continues.
The 50 percent level is seen as a balance point where the market is testing supply and demand.
The 61.8 percent and 78.6 percent levels are considered deeper pullback zones, which often appear when the market is cooling off or preparing for a short-term reversal.
Traders view Fibonacci not as fixed numbers but as a way to gauge trend strength.
Traders treat Fibonacci levels as zones, not precise lines
On real charts, price rarely reacts at an exact number. Instead, areas around 50 to 61.8 percent or 23.6 to 38.2 percent are considered reaction zones.
This allows traders to be more flexible and wait for confirmation signals rather than expecting price to touch an exact level.
Fibonacci only gains value when combined with market structure and confirmation signals
Professional traders interpret each level within the broader context:
What is the main trend?
What was the momentum before the pullback?
Is there a reversal candle, rising volume, or divergence?
Does the Fibonacci level align with any support or resistance zone?
A Fibonacci level only becomes meaningful when it aligns with other factors to form a high-probability trade thesis.
Traders use Fibonacci to anticipate market behavior, not to predict the future
In real trading, Fibonacci helps traders:
Observe how price reacts as it approaches key areas
Determine whether trend strength is weakening or staying strong
Build context to find better entries rather than using it as a tool to “forecast” future price direction
For that reason, the logic behind Fibonacci retracement lies not in the tool itself but in how traders use it to clarify price behavior within the context of the trend.
How Fibonacci retracement works in real trading environments
To understand how Fibonacci retracement works in real trading, the important point is not to memorize the percentage levels but to observe how the market moves around them. When traders apply the tool to a chart, the goal is not to predict the exact reversal point but to identify high-probability areas where price may react during a pullback.
There is a general process that most practical traders follow:
Identify the main market trend
Fibonacci retracement only has meaning when the market is in a clear trend, either upward or downward. In an uptrend, the tool is applied from the swing low to the swing high; in a downtrend, the opposite applies.
If the market is moving sideways, Fibonacci often produces noisy signals and does not work effectively.
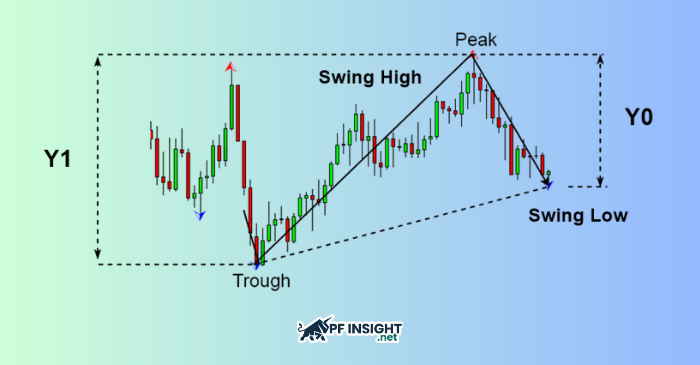
Select the swing high and swing low as reference points
Illustration of how to identify swing highs and swing lows to draw a Fibonacci retracement in a real trend.
Traders usually choose clear pivot points where price forms a high or a low with a noticeable change in structure. Selecting the wrong swing points makes the Fibonacci levels meaningless because the reaction zones will not align with actual market dynamics.
In reality, charts are not always clean, so most traders choose swing points based on
Highs or lows with notable volume
Strong reversal candles
A clear change in market structure (break of structure)
Observe how price behaves as it retraces into Fibonacci zones
Once the tool is applied to the chart, price tends to retrace to different levels depending on market conditions:
Shallow pullback (23.6 to 38.2 percent): The trend is strong, and buying or selling pressure remains solid.
Moderate pullback (50 percent): The market is testing opposing forces. This is one of the most commonly watched levels.
Deep pullback (61.8 to 78.6 percent): A sign that the trend is slowing or preparing for a short-term reversal.
It is important to remember that price rarely reacts at a single exact point. Instead, it often creates wicks, liquidity traps, or small fluctuations around the Fibonacci zone before deciding its next move.
Confirmation signals determine how Fibonacci works
In real trading, Fibonacci is only a reference framework. Whether price reacts as expected depends on:
Price action signals such as pin bars, engulfing patterns, or rejection wicks
Previous momentum
Volume
Confluence with moving averages, trendlines, or support and resistance
Overall market sentiment
In other words, Fibonacci does not work on its own. It works when traders recognize familiar signals around these levels and collectively make decisions, creating a shared market reaction.
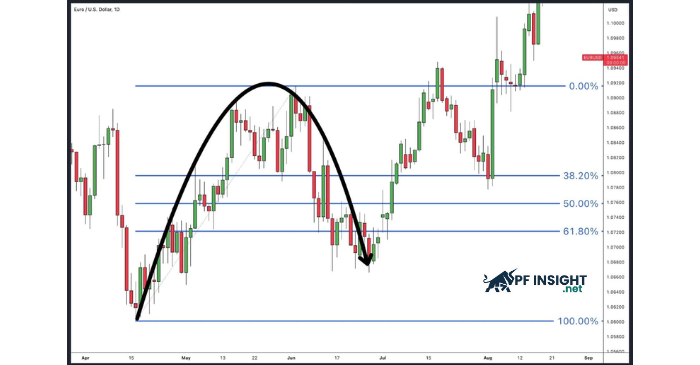
Illustration of how Fibonacci works in real trading (case study)
Real example: price retraces to the 50 to 61.8 percent Fibonacci zone before continuing the trend.
Imagine the market is in an uptrend and the swing low and swing high are chosen as the two newly formed extreme points. As price pulls back:
Price begins to fall toward the 38.2 percent zone, but the reaction is still weak
It continues to slide deeper into the 50 to 61.8 percent zone
A reversal candle or rising volume appears
The trader enters a long position with a stop loss below the 61.8 percent zone
Price then bounces back in line with the trend and returns to retest the previous high
This is how Fibonacci retracement works in real market conditions. It does not predict a reversal but highlights the areas where the market is most likely to react.
When Fibonacci works well and when it performs poorly
In real trading, Fibonacci retracement is most effective when:
The market has a clear trend
The pullback has clean structure
There is confluence with other technical factors
Market sentiment is stable without major news-driven volatility
On the other hand, it performs poorly in:
Sideways markets
Periods of heavy noise or liquidity hunts
Weak trends that break structure repeatedly
In essence, the way Fibonacci retracement functions in real trading conditions is not mysterious at all. It is driven by collective behavior, market structure, and the context of each pullback.
How traders use Fibonacci retracement to build actionable setups
Although Fibonacci retracement is used to highlight price zones where reactions may occur, traders only turn it into an actual advantage when they combine it with confirmation signals and clear trading rules. In practice, a trading setup built around Fibonacci usually includes three core components: entry, stop loss, and take profit. All of them are based on how price behaves at each retracement level. Below is how traders use Fibonacci to build high-quality, actionable setups:
Find the entry point during the pullback
Traders do not enter a trade simply because the price touches a Fibonacci level. An entry is valid only when there is confirmation from price action or other technical tools.
Common confirmation signals include:
Reversal candles such as pin bars, engulfing patterns, or hammers at the 38.2, 50, or 61.8 percent levels
Price pausing at a Fibonacci level that overlaps with support or resistance
A small break of structure in the direction of the main trend
Why is this effective? Fibonacci defines the zone. The confirmation signal defines the timing of the entry.
Place the stop loss based on Fibonacci structure
Stop losses are not placed arbitrarily. They follow a logic that protects the trade:
If the entry is at 38.2 percent or 50 percent, the stop loss is usually placed below 61.8 percent.
If the entry is at 61.8 percent, the stop loss is placed below 78.6 percent or below the swing low in an uptrend.
In a downtrend, the logic is reversed.
Placing the stop loss below the next Fibonacci level helps avoid being shaken out by minor noise while still protecting the trade if the market genuinely reverses.
Determine take profit levels with Fibonacci extension
When price moves back in the direction of the trend, traders use Fibonacci extension to set targets:
100 percent: the previous high
161.8 percent: a strong continuation target
261.8 percent: used less often, reserved for exceptionally strong trends
In uptrends, TP1 is often set at the previous pivot high and TP2 at the 161.8 percent extension.
Confidence increases the probability of success
A strong Fibonacci setup does not stand alone. It usually aligns with multiple elements:
Fibonacci level overlapping with the 20 or 50 moving average
The 61.8 percent level lining up with major support or resistance
The 38.2 to 50 percent zone aligning with a trendline
Increasing volume when a reversal signal appears
Harmonic patterns or Elliott wave structure supporting the pullback
The more the confluence of ore, the higher the probability of the setup.
Example of a real trading setup (from the case study)
When price retraces to the 50 to 61.8 percent zone:
A bullish engulfing candle appears
Volume increases slightly at the reaction zone
The trader places a buy entry above the confirmation candle
Stop loss is placed below 61.8 percent
TP1 is placed at the previous pivot high, and TP2 at the 161.8 percent extension
This is one of the most common Fibonacci trading setups because it is easy to spot, easy to manage, and easy to standardize.
The goal of traders using Fibonacci is not to catch tops or bottoms
Trading with Fibonacci is not about predicting the exact reversal point but about:
Identifying zones with high reaction probability
Waiting for confirmation signals
Executing trades based on rules
Managing risk when the setup does not play out
With this rule-based approach, Fibonacci retracement becomes a practical tool for traders of all experience levels in real market conditions.
Conclusion
Fibonacci retracement functions in real trading as a reference framework that helps traders read the depth of a pullback and identify price zones where reactions are likely to occur. When applied in the correct trend, combined with proper swing point selection and confirmation signals, the 38.2, 50, and 61.8 percent levels become valuable foundations for optimizing entries and managing risk. However, this tool is not a predictive signal and becomes less effective in noisy or sideways markets. The value of Fibonacci retracement lies in its confluence with price action and market structure rather than in the numbers themselves. When used correctly, it helps traders build more stable and higher-probability strategies.
Follow our Knowledge Hub for more articles, and we wish you successful trading.