
The MACD indicator is one of the most powerful technical analysis tools, widely used by traders to identify trends and reversal signals. Thanks to its ability to combine moving averages and momentum, MACD helps traders identify entry and exit points more accurately. Understanding how MACD works is crucial for improving trading performance.
- Liquidity grab strategy: Simple methods beginners can apply
- Bollinger Bands common mistakes traders make and how to avoid them
- Automated trading system benefits and challenges every trader should know
What is the MACD indicator?
The MACD indicator, short for Moving Average Convergence Divergence, helps traders monitor the strength of a trend and the potential for price reversals. By showing the convergence and divergence of moving averages, the MACD helps identify potential reversal signals and opportune trading times.
The MACD indicator was developed by investment expert Gerald Appel in 1979 and quickly became one of the most important indicators in technical analysis. MACD’s strength lies in its ability to combine trend and momentum, helping traders better understand market structure. Beyond providing a single signal, MACD offers multiple approaches such as signal line crossovers, divergences, and histogram analysis, providing a comprehensive view of price action.
The MACD indicator is calculated using the following formula:
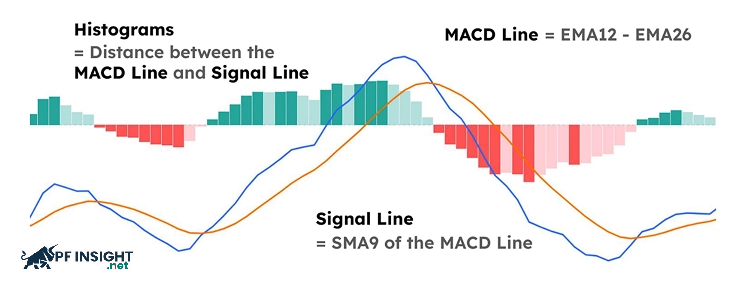
MACD = 12-Period EMA – 26-Period EMA
Structure of the MACD indicator
The MACD indicator is composed of four key components, each playing a specific role in providing traders with a clear view of market trends.
The MACD line
The MACD line, also known as the fast line, directly reflects the price trend through the calculation of EMA(12) minus EMA(26). Therefore, traders can assess the current momentum of the asset. If the MACD line is above 0, the market shows upward strength; when it is below 0, downward momentum prevails.
- The MACD shows a positive value when the 12-day EMA crosses above the 26-day EMA, indicating that upward momentum is dominant in the market.
- The MACD shows a negative value when the 12-day EMA is below the 26-day EMA, reflecting stronger downward momentum and a potential weakening trend.
The signal line
Formed from the 9-period SMA of the MACD indicator, the signal line helps reduce noise and clarify market movements. As a lagging line, it assists traders in observing significant trend changes and finding more accurate entry points.
Calculation method: The Signal line is determined by taking the 9-period EMA of the MACD line.
The histograms
The histogram in the MACD indicator shows the distance between the MACD line and the Signal line. Tall bars appear when the two lines widen the gap, while short bars signal convergence. This tool helps traders grasp momentum changes and assess the strength of the current trend.
Calculation method: The histogram is determined by the difference between the MACD line and the Signal line.
- When the histogram appears above 0, meaning the MACD line is higher than the Signal line, it reflects that upward momentum is prevailing in the market.
- When the histogram is below zero, and the MACD line is lower than the Signal line, it indicates that downward momentum is strengthening and the trend may be weakening.
Zero line
The zero line is the center level of the MACD and histogram, helping to determine whether the MACD is in a positive or negative state. When the MACD indicator crosses this line, it is a significant sign reflecting a substantial change in price action.
- When the MACD line moves above the zero line, it indicates that the EMA 12 has crossed above the EMA 26, reflecting the consolidation of upward momentum and signaling an uptrend.
- When the MACD line falls below the zero line, meaning the EMA 12 has dropped below the EMA 26, it indicates weakening momentum and the potential for a downtrend to form.
The zero line acts as a central marker, helping traders quickly identify whether the market is leaning towards an overall uptrend or downtrend.
5 effective trading methods with MACD indicator
Thanks to its ability to combine trend and momentum, the MACD indicator is suitable for many different trading methods. Below are some of the most prominent techniques using MACD, helping traders identify trends and find quality trading opportunities.
Reversal pattern using MACD indicator
Experienced traders often monitor MACD charts to identify when momentum reverses. They focus on changes in pace and histogram shape, looking for patterns such as double tops or head and shoulders to further confirm reversal signals.
These patterns appear on the MACD chart rather than directly on the price chart, reflecting that momentum may be shifting in a different direction than the actual market movement.
- Double top pattern: Two consecutive tops on the histogram chart indicate that upward momentum attempted another breakout but failed to surpass the previous peak, reflecting a weakening of the buying pressure. Conversely, a double bottom pattern on the MACD usually signals decreasing selling pressure and a potential upward reversal.
- Head and shoulders pattern: The head and shoulders pattern forms on a histogram chart when momentum initially rises sharply, then weakens, and then recovers slightly before falling again. This structure reflects a classic price pattern, represented by the bars of the MACD chart.
MACD crossover strategy
This is the most common strategy when using the MACD indicator, based on the crossover signal between the MACD line and the Signal line to determine entry points.
Entry rules:
- Buy position: Open a Buy order when the MACD line crosses above the Signal line and both lines are below the zero line, indicating that upward momentum is beginning to form.
- Sell position: Execute a Sell order when the MACD indicator crosses below the Signal line while both lines are above the zero line, reflecting a weakening signal and a potential bearish reversal.
Exit rules:
- Long-term buy position: Close the Buy order when the MACD line falls and crosses below the Signal line, indicating that the upward momentum has weakened.
- Short selling position: Close the Sell order when the MACD line crosses above the Signal line, indicating that downward pressure is easing and the trend may reverse.
Note: This strategy works best in strongly trending markets. Traders can increase accuracy by assessing the overall trend and incorporating additional confirmation indicators to filter out noise signals.
Zero line crossover strategy
The zero-crossing strategy emphasizes identifying significant trend changes based on whether the MACD indicator crosses above or falls below the center line.
Entry rules:
- Buy position: Open a Buy order when the MACD indicator breaks above the zero line, signaling that upward momentum is dominant.
- Sell position: Execute a Sell order when the MACD falls below the zero line, indicating that bearish momentum is forming and the trend may reverse downwards.
Exit rules:
- Long-term buy position: Close the Buy order when the MACD indicator declines and falls below the zero line, signaling that the uptrend may have ended.
- Short selling position: Close the sell order when the MACD indicator breaks above the zero line, indicating weakening downward momentum and a potential upward reversal in the market.
Note: This strategy provides fewer signals compared to the MACD crossover method, but it helps traders identify larger and more reliable trend changes, especially in markets with strong momentum.
MACD histogram trend continuation patterns
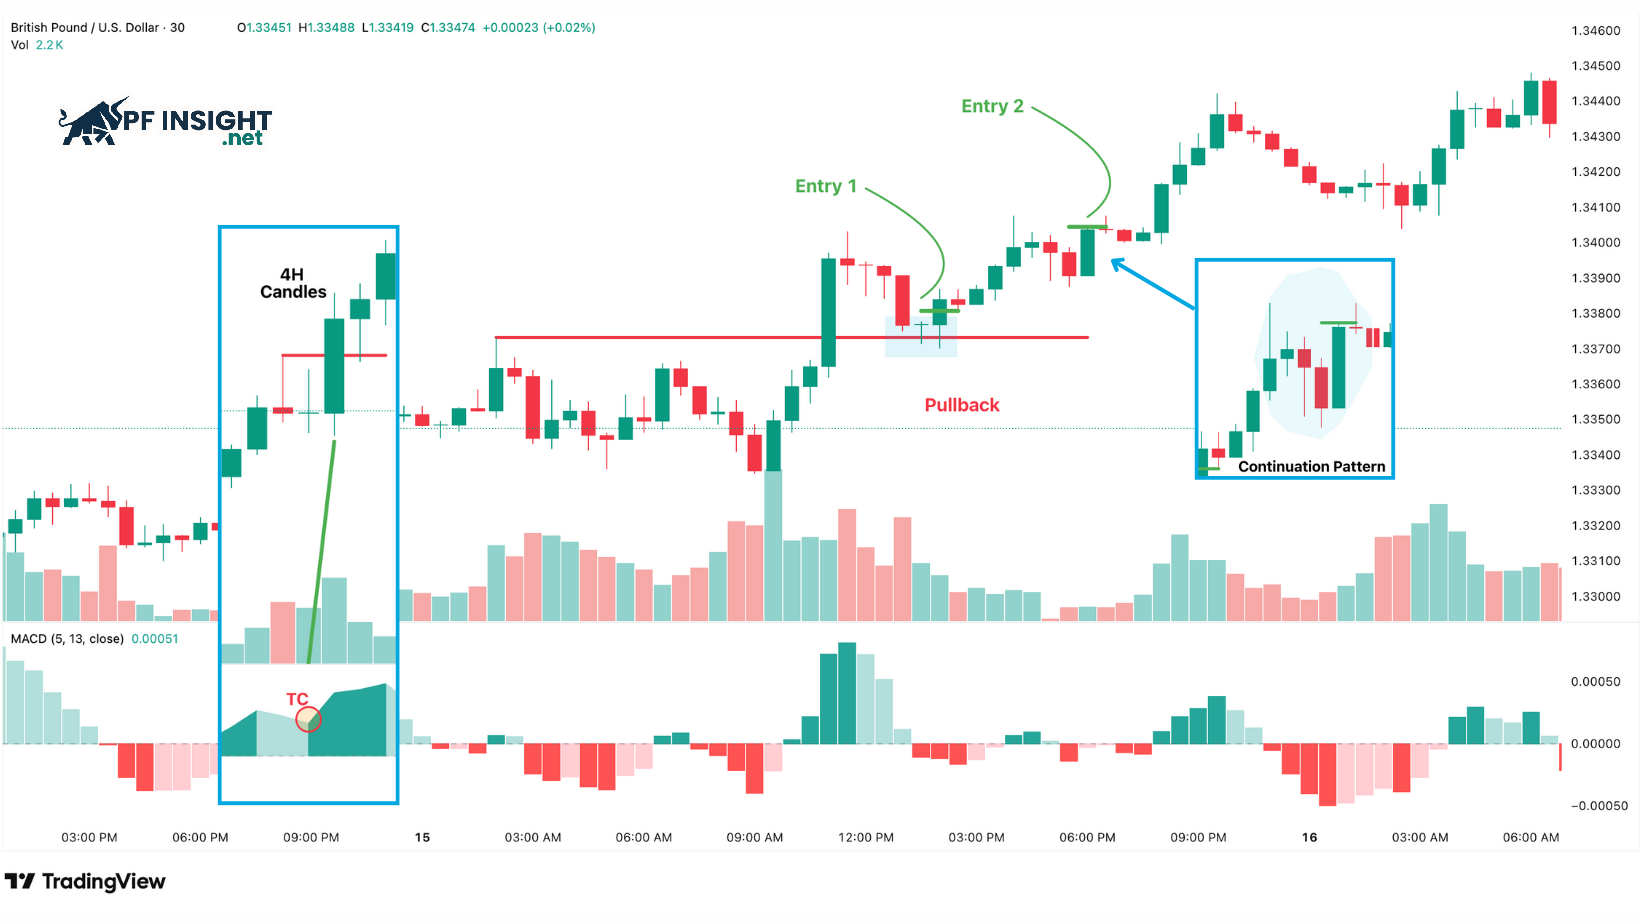
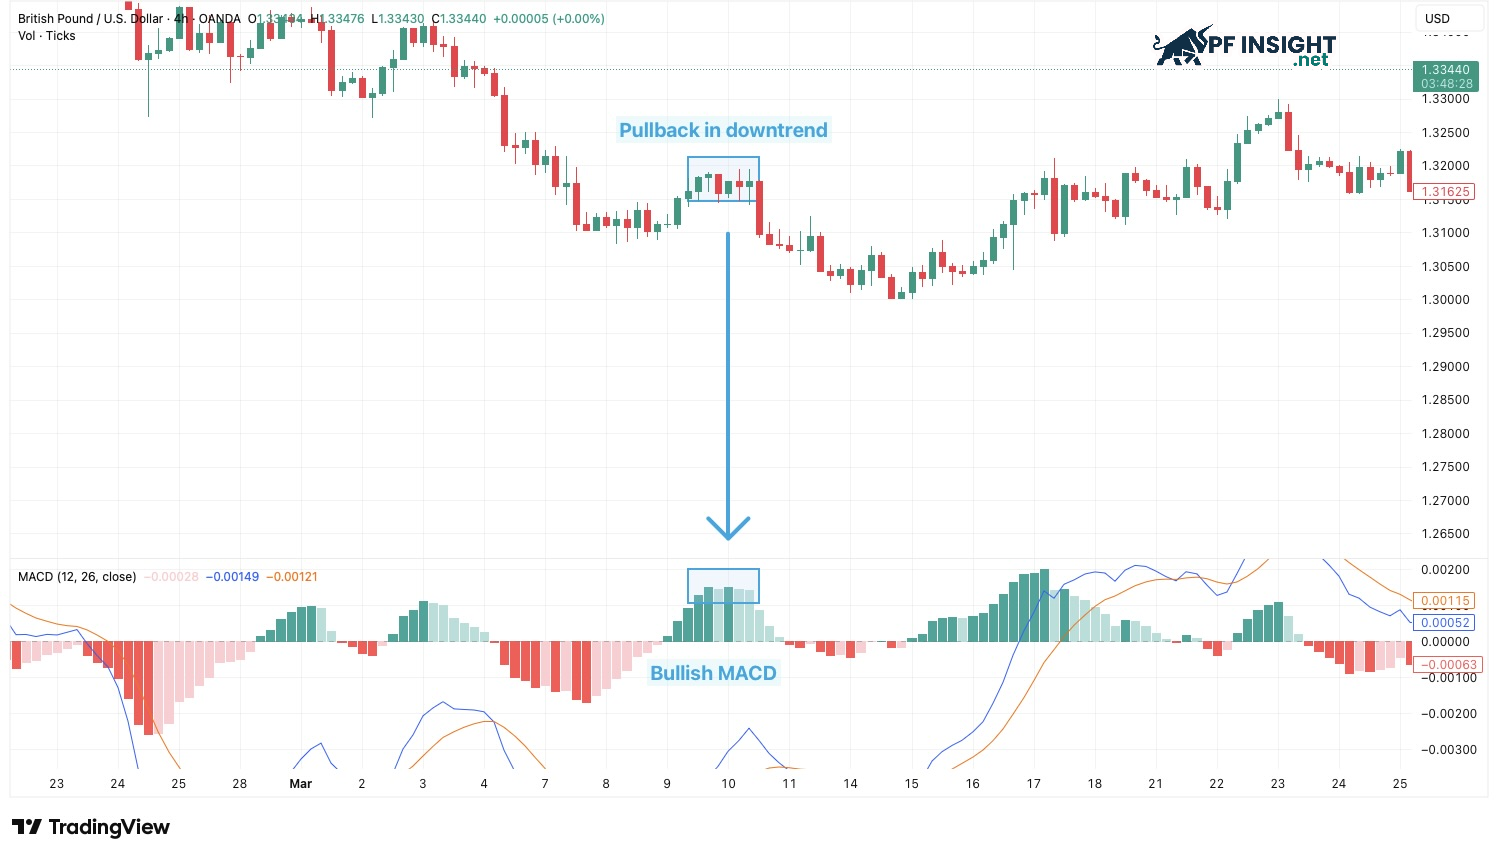
MACD histogram patterns not only signal reversals but also help identify trend continuation. When the market pauses after a strong rally, the histogram typically narrows before widening back in the original direction. This setup suggests momentum is only temporarily declining before the main trend resumes, giving traders more confidence in holding positions in the trend.
For example, in an uptrend, when the histogram shows large positive bars that shrink during a short correction, then expand again, it indicates that the upward momentum is still strong. Similarly, in a downtrend, negative bars that narrow and then expand usually reflect that selling pressure remains dominant.
Divergence trading strategy
Divergence trading strategies focus on detecting discrepancies between price action and the MACD indicator. When price continues to create new highs or lows but the MACD does not confirm them, traders can anticipate a potential reversal.
Entry rules:
- For buy orders: Traders can open a position when a bullish divergence appears, meaning the price forms a lower low but the MACD forms a higher low, indicating weakening selling pressure and the possibility of an upward reversal.
- For sell orders: You can enter a trade when a bearish divergence appears, when the price creates a higher high but the MACD creates a lower high, signaling weakening upward momentum and a risk of a bearish reversal.
Exit rules:
- For buy orders: Traders should close their positions when the price reaches the nearest resistance zone or when a bearish divergence appears, indicating that the upward momentum may weaken.
- For sell orders: You can exit the order when the price approaches a key support zone or when a bullish divergence appears, signaling a potential upward reversal.
Note: Divergence strategies often provide early reversal signals, helping traders prepare for large price swings. However, identifying divergence patterns requires good observation skills and experience in reading indicators to avoid misinterpreting the signals.
Tips for using the MACD indicator effectively in trading

To use the MACD indicator effectively, you need to pay attention to the following issues:
- Minimize false signals: It is advisable to combine the MACD indicator with price action or other supplementary indicators to confirm trades before entering a trade, avoiding the risk of false signals.
- Prioritize trend-following trades: The MACD indicator is most accurate when used in line with the market’s main trend, rather than against it.
- Assessing signal strength: When the gap between the MACD line and the signal line widens, market momentum usually increases, indicating the potential for a strong price movement.
- Look for convergence: The most reliable setups appear when multiple MACD signals emerge simultaneously, increasing the certainty of the entry decision.
- Multi-timeframe analysis: Observe the MACD indicator on a larger timeframe to identify the dominant trend, then switch to a smaller timeframe to find the precise entry point.
- Combining supporting tools: Use MACD in conjunction with other indicators or price action to increase signal reliability and minimize the risk from noise signals.
- Consider market sentiment: The effectiveness of the MACD indicator varies depending on whether the market is trending, sideways, or highly volatile, so traders need to interpret it appropriately.
- Be patient: Only act when a clear and reliable signal appears, and avoid trading based on every MACD indicator crossover.
- Adhere to risk management: No matter how strong the signal is, always set a stop-loss and choose a reasonable order size to protect your account.
Advantages and disadvantages of the MACD indicator
The MACD indicator is highly regarded by many traders for its ability to combine trend and momentum in a single indicator. However, its characteristic lag and the risk of noise signals lead some traders to choose more flexible tools.
Advantage
- Combining trend and momentum information in a single system gives traders a more comprehensive view of market developments.
- Highlighting momentum change signals through MACD-Signal line crossovers and histogram expansion or contraction.
- Flexible across multiple timeframes, suitable for both short-term trading and long-term analysis.
- Compatible with most charting platforms, with values automatically calculated by the software, making it easy and convenient for traders to use.
Disadvantages
- MACD reacts slowly, so by the time a signal appears, the market may have already moved a significant distance, reducing the advantage of entering a trade early.
- It performs poorly during periods of sideways movement or high volatility, as signals often arrive too late or too early, making it difficult to identify the true trend.
- Noise signals can easily arise when volume is low or unusual price fluctuations occur, leading traders to misinterpret market momentum.
Conclude
The MACD indicator remains a crucial tool for traders to monitor momentum and visually assess trends. When used correctly and combined with tight risk management, it offers a significant advantage in trading. PF Insight recommends that traders practice regularly to understand the characteristics of the MACD, thereby applying it flexibly and improving trading performance.


