Bollinger Bands is a famous technical indicator that helps traders visually identify trends and market volatility. This tool, developed by John Bollinger, helps assess risks and find potential trading opportunities. So how do Bollinger Bands work and how can they be applied effectively? Let’s pfinsight.net explore the details in this article.
Bollinger Bands are a type of price envelope developed by John Bollinger to identify upper and lower price zones in the market. These bands are created based on the standard deviation from a simple moving average (SMA). Since the distance between the bands reflects the standard deviation, Bollinger Bands automatically widen when volatility increases and narrow when volatility decreases.
Bollinger Bands work based on two parameters: Period and Standard Deviation. By default, the period is set at 20 and the standard deviation is 2, but traders can customize it according to their needs.
Bollinger Bands, thanks to its structure consisting of an upper band, a lower band, and a moving average, help assess the current price position relative to normal volatility. However, this indicator is not suitable for independent use. Traders should consider Bollinger Bands as a complementary element to confirm signals from other analytical tools.
Components of Bollinger Bands
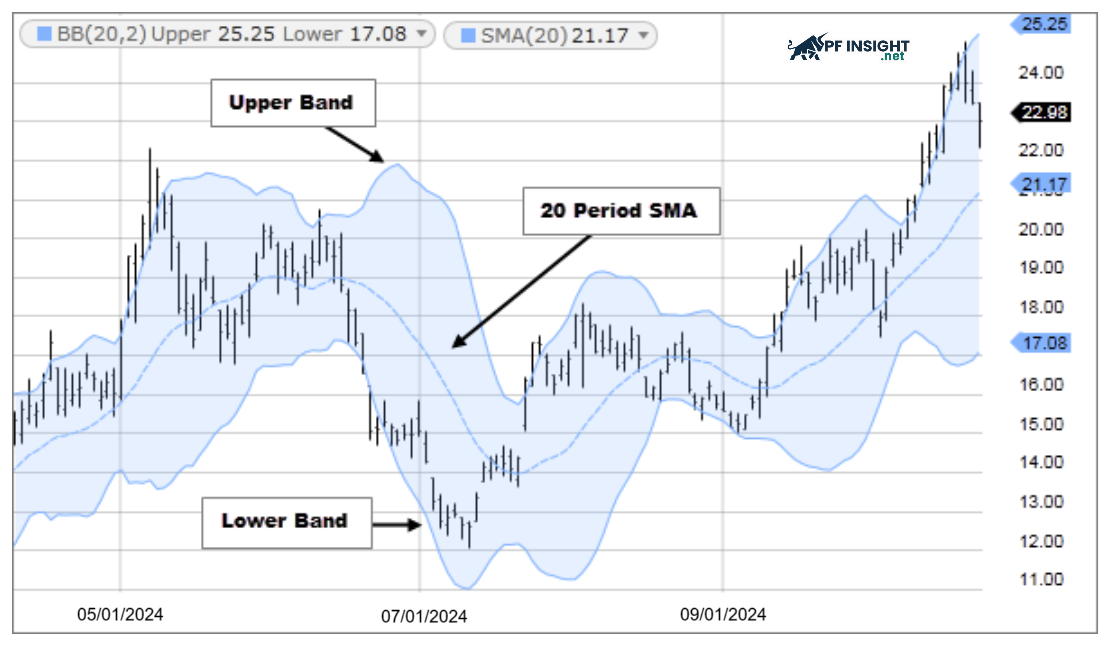
Bollinger Bands are made up of 3 bands
Bollinger Bands are made up of 3 bands:
Upper Band: Calculated by SMA20 plus twice the standard deviation of the price.
Middle Band – SMA20: The middle band is created by a 20-session simple moving average, calculated based on closing prices, helping traders identify the main direction of the market.
Lower Band: Calculated by SMA20 minus twice the standard deviation of price.
Standard deviation represents the price’s variation from the average. During sideways periods, Bollinger Bands become a useful tool: traders can sell when the price touches the upper band and buy when the price reaches the lower band to find a reasonable reversal point.
John Bollinger, founder and chairman of Bollinger Capital Management, has created two bands that are two standard deviations away from the moving average to flexibly reflect market volatility. This structure allows for simulation of real-world volatility, making it easy for investors to assess when an asset is falling into overbought or oversold territory.
Price rising to touch or exceed the upper band usually signals an overbought condition.
When the price falls back to touch or below the lower band, the market is in oversold territory.
Formula for calculating Bollinger Bands indicator
Unlike traditional technical tools that rely on fixed ratios, Bollinger Bands are calculated based on standard deviation – a measure of price volatility around an average line. This allows Bollinger Bands to react quickly and accurately to market fluctuations.
Standard deviation và variance
The first step in calculating the standard deviation is to calculate the variance, which is determined by the formula below:
σ² = (∑(χ – SMA)²) / N
Next, the standard deviation (σ) is determined by taking the square root of the variance value.
σ = √ ((∑(χ – SMA)²) / N)
If you want to create Bollinger bands with 2 or 3 standard deviations, you just multiply the 𝜎 value by the desired coefficient.
=>> Bollinger Bands indicator includes 3 bands calculated by the following formula:
Upper Band = SMA20 + 2 × Standard Deviation of the last 20 days.
Middle Band (SMA20) reflects the average price of the last 20 sessions.
Lower Band = SMA20 – 2 × Standard Deviation of the last 20 days.
Note: SMA20 is formed by taking the average closing price of 20 trading days. This period is often chosen because it reflects the medium-term trend relatively clearly, equivalent to two weeks of market activity.
How does this indicator work?
How does this indicator work?
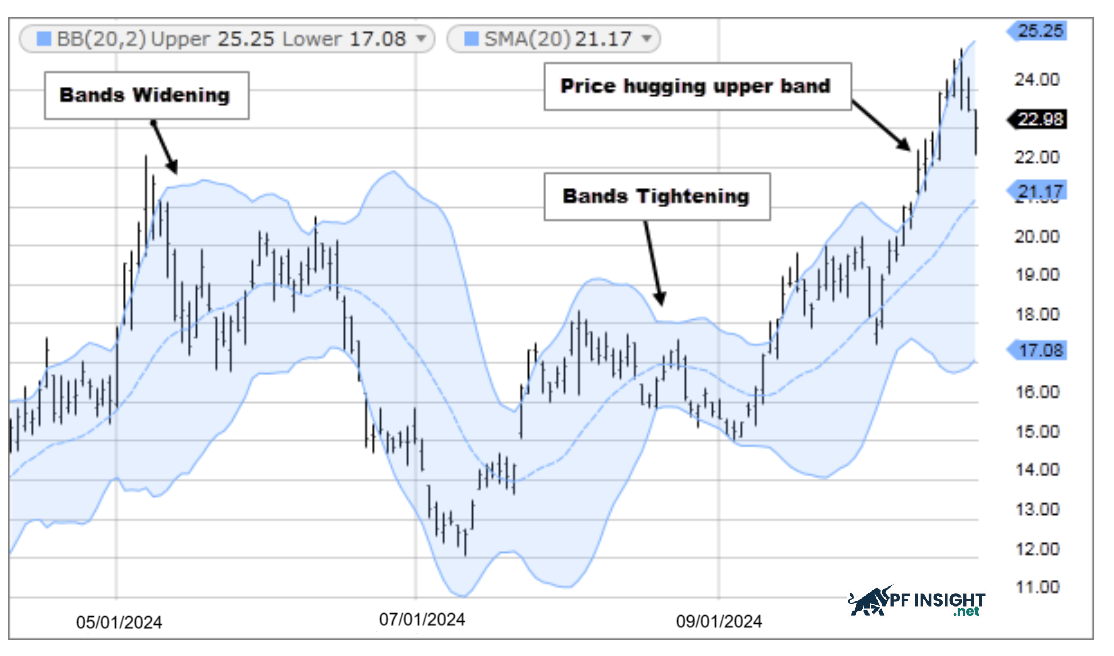
Bollinger Bands work based on price volatility, specifically:
When Bollinger bands narrow due to low market volatility, the probability of a strong price breakout in either direction increases. This signals the start of a new trend. However, traders should be wary of false breakouts when the price reverses before the main trend has formed.
When the distance between the Bollinger bands widens abnormally, the market enters a period of high volatility. This can signal the current trend is about to end and a new price movement is likely to appear.
Price action tends to fluctuate within the range created by the two bands. You can use this back and forth movement to determine where to take profits. If the price rebounds from the lower band and breaks above the moving average, the upper band is often seen as a potential target.
During periods of strong price increases or decreases, prices can stay close to the Bollinger bands for extended periods of time. When a divergence signal appears from the momentum indicator, this is when you should consider whether taking further profits is appropriate for your strategy.
A breakout of the band usually indicates that market momentum is strengthening. However, if the price then returns back within the band, the signal is no longer confirmed and the trend momentum may be decreasing.
Mistakes when using Bollinger Bands
Bollinger Bands explained – Mistakes when using Bollinger Bands
Bollinger Bands are a powerful technical analysis tool, but using them incorrectly can lead to incorrect trading decisions. Here are some common mistakes:
Misunderstanding the meaning of upper and lower bands: Many traders think that touching the upper band is a sell signal and touching the lower band is a buy signal. In fact, touching the band does not mean the market is reversing, sometimes it signals that the trend is strengthening.
Trading against the trend too early: In a strong trending market, prices can ride the band for a long time. Inexperienced traders often enter counter-trend orders too early, leading to losses.
Using Bollinger Bands alone without combining other indicators: Bollinger Bands measure volatility but do not predict price direction. Without combining RSI, MACD or Price Action, traders are prone to making decisions without data.
No distinction between sideways and trending markets: Bollinger Bands work best when the market is sideways. When the market is trending strongly, Bollinger Bands-based reversal signals become less accurate.
Misunderstanding the Bollinger Squeeze phenomenon: Many people consider every band tightening as a breakout signal. But in reality, you need to observe additional candlestick patterns or volume for confirmation, otherwise it is easy to have a false breakout.
Ignore the psychological factor and risk management: No matter how good Bollinger Bands are, if you do not set a stop-loss or use too much leverage, it is easy to burn your account.
Using the default parameters mechanically: The parameter of 20 periods – 2 standard deviations is common, but not always appropriate. Some highly volatile markets may require adjusting the cycle accordingly.
How to use Bollinger Bands in trading
Below are three strategies to help you apply Bollinger Bands properly, thereby optimizing trading safety and efficiency.
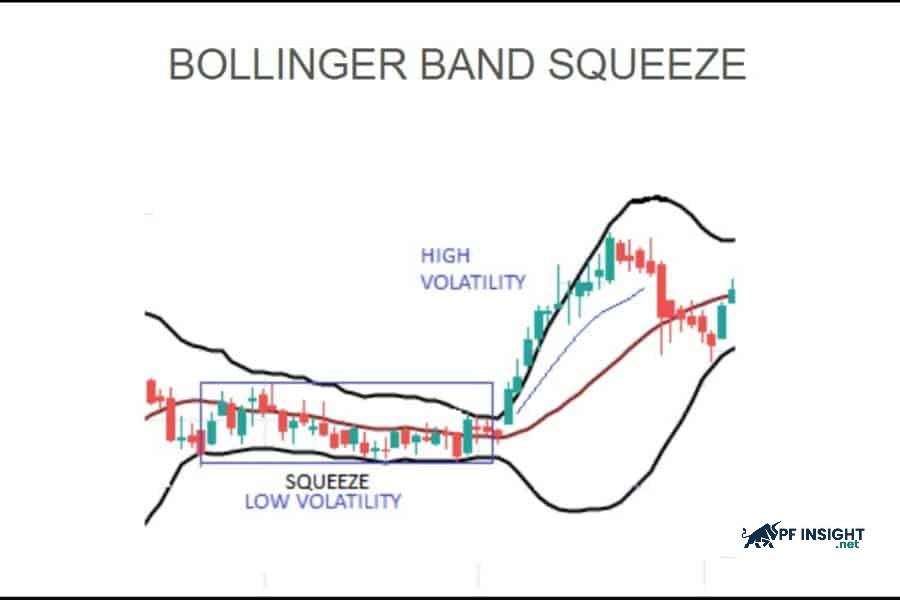
Bollinger Band Squeeze
Bollinger Band Squeeze, commonly known as the “bottleneck” pattern
Bollinger Band Squeeze, commonly known as the “bottleneck” pattern, is a useful technique during periods of consolidation and low volatility. When the Bollinger bands narrow abnormally, the market is likely to enter a period of high volatility. Investors can watch for a breakout signal to determine the appropriate trading direction.
Buy: When price breaks out of the accumulation zone and breaks above the upper Bollinger band.
Sell: When price breaks the accumulation zone and slides below the lower Bollinger band.
While Bollinger Bands provide important signals, entering a trade simply because the price touches the upper or lower band is risky. Inexperienced traders, in particular, can easily misinterpret the signals without using additional tools. This strategy is most suitable when the market fluctuates in a narrow range and there is no clear trend.
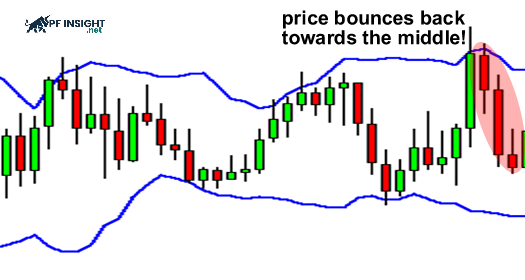
Bollinger Bounce
Bollinger Bands tend to make prices return to the center after touching the outer band.
Bollinger Bands tend to make prices return to the center after touching the outer band. Based on this characteristic, the Bollinger Bounce strategy was born, helping investors take advantage of the rebound from the upper or lower band to find a safer and more reasonable entry point.
The two outer bands of Bollinger Bands act as support and resistance zones of volatility, so traders often apply this strategy based on the principle of price reaction when touching the outer bands.
Sell: When the price approaches or touches the upper Bollinger band.
Buy: When the price touches the lower Bollinger band.
Although Bollinger Bounce provides a fairly clear signal, this strategy is most effective when the market is sideways and volatile. Conversely, in a strong trend, the price may continuously stick to the band, making the bounce signal less reliable and increasing the risk of trading.
Bollinger bands combined with RSI and MACD
Bollinger bands combined with RSI
Bollinger bands combined with RSI
RSI (Relative Strength Index) introduced by Welles Wilder, is an important technical indicator used to measure the strength of price trends and determine overbought or oversold market conditions.
Although this method has a simple structure, its effectiveness will be significantly enhanced when traders combine it with other indicators to confirm the signal. The strategy works well in periods when the market fluctuates slightly and the trend is not too noisy. Thanks to the ability to identify overbought and oversold zones, it helps investors find reasonable trading points, supporting improved winning rates without the need for complex techniques.
Here is the process of applying the Bollinger Bands combination strategy:
Step 1: Set up Bollinger Bands and RSI on the price chart
Bollinger Bands: Set the center line to EMA 50, standard deviation 2.00 and apply the indicator to the closing price.
RSI: Set the calculation period to 9 periods and use data from closing prices.
Step 2: Look for signals to open trading positions
Sell Order: When RSI crosses 75 and price touches or penetrates the upper band of Bollinger Bands but the candle closes inside the band, it is a sign that buying pressure may be weakening. You can open a sell order on the next candle.
Buy Order: When RSI falls below 25 and the price touches or breaks the lower band slightly but the candle still closes inside the band, it is a signal that selling pressure is weakening. At this point, you can place a buy order on the next candle.
Step 3: Determine the take profit or stop loss position
Stop loss: Set the stop-loss level about 5% above the high of the signal candle to limit risk.
Take profit:
Target 1: Close a part (50%) of the position when the price approaches the center line of the Bollinger Bands.
Target 2: Close the entire trade when the price touches the opposite Bollinger band.
Trailing stops can be activated after reaching the first target to increase the profit level.
This method allows traders to quickly identify overbought/oversold conditions and adjust their strategies in time when the market begins to change direction.
Bollinger bands combined with MACD
While Bollinger Bands measure price volatility and range, MACD excels in identifying trend momentum. This combination gives investors a more comprehensive view, increasing the reliability of trading signals. As a result, Bollinger Bands and MACD not only indicate whether prices are in an uptrend or downtrend, but also warn of the possibility of an upcoming breakout.
Advantages and disadvantages of Bollinger Bands indicator
Bollinger Bands are an effective volatility measuring tool that helps identify overbought/oversold conditions. However, they do not predict the direction of the trend and require combining with other indicators.
Advantage
Bollinger Bands provide a visual representation of price volatility, allowing traders to quickly assess market conditions. They are flexible, expanding when prices fluctuate widely and contracting when the market moves sideways.
These bands also help identify overbought and oversold zones: when the price approaches the upper band, the market may be overbought; when the price approaches the lower band, the market shows oversold conditions.
Bollinger Bands can generate buy and sell signals in both trending and ranging markets. Unlike many other indicators, Bollinger Bands are flexible, allowing for a variety of trading strategies, some of which are better suited to range markets, while others are more effective when the market is clearly trending.
Bollinger Bands can be combined with other indicators such as RSI, Stochastic or price patterns to increase reliability and confirm trading signals more accurately.
Disadvantages
Bollinger Bands can sometimes give false signals in strongly trending markets. When prices stick to the bands in an uptrend or downtrend, early exits or counter-trend entries can fail. Furthermore, during periods of high volatility, sudden price breakouts can create false signals, requiring traders to be more cautious.
Bollinger Bands are considered a lagging indicator because they are based on moving averages. Therefore, some strategies that use Bollinger Bands may provide entry signals that are late compared to the actual market volatility.
The variety of Bollinger Bands trading strategies is both an advantage and a limitation, as signals can be interpreted differently. For example, when the price touches the lower band, some traders see it as a bearish breakout signal, while others see it as a bullish reversal within the range.
Tips for effectively applying Bollinger Bands in practice
To use Bollinger Bands effectively in the market, investors should apply the following tips to help improve accuracy and optimize profits.
Confirm signals with additional indicators: Combine Bollinger Bands with other technical tools such as RSI or MACD to increase confidence before entering an order.
Choose the right timeframe: Adjust the number of periods of Bollinger Bands according to the trading timeframe, for example 10 periods for day trading and 50 periods for medium-term trading.
Risk Management: Set stop-loss based on market volatility and personal risk tolerance. Also, adjust trading volume according to the width of Bollinger Bands to effectively control risk.
Limit overtrading: Only enter orders when there is a clear signal from Bollinger Bands, avoid reacting to every small price fluctuation.
Conclude
Bollinger Bands are a versatile tool that helps short-term traders identify potential entry and exit points based on price action and overbought/oversold conditions. When combined with other technical indicators, investors can increase the accuracy of their analysis, improve their decision-making process, and optimize their overall trading performance. Understanding how to use Bollinger Bands is key to managing risk and exploiting opportunities effectively.