In technical analysis, trend confirmation indicators are key tools that help traders identify trends into profits. These indicators assess the stability and momentum of prices, thereby filtering out noise signals or false trends. As a result, traders can make accurate decisions, avoid risks and optimize their trading strategies.
- 5 Must-know quantitative trading strategies for consistent profits
- Best free Forex signal Telegram groups in 2025
- Types of pullback – How to identify and trade each one
What is a trend confirmation indicator?
Trend confirmation indicators act as a signal filter, helping traders avoid fakeouts and noise. By tracking momentum and price action, these indicators help identify trend continuation or warn of a possible reversal. This helps traders avoid hasty decisions.
Trend confirmation indicator is always loved by traders because of the following advantages:
- No-repaint capability: Signals once generated will not be changed, ensuring transparency and high reliability for every trading strategy.
- Flexibility: Trend confirmation indicator can be used on any time frame, suitable for traders who prioritize trend analysis on daily charts or large time frames.
- Provides clear signals: This tool makes trading decisions easier thanks to transparent trend signals, and the effectiveness is further increased when traders combine price action or other supporting indicators.
What types of trend confirmation indicators are there?
Trend confirmation indicators are responsible for filtering out noise signals and false price movements, helping traders feel more confident when entering the market. The goal is to avoid price traps and only trade when the trend is strongly consolidated.
Fibonacci retracement
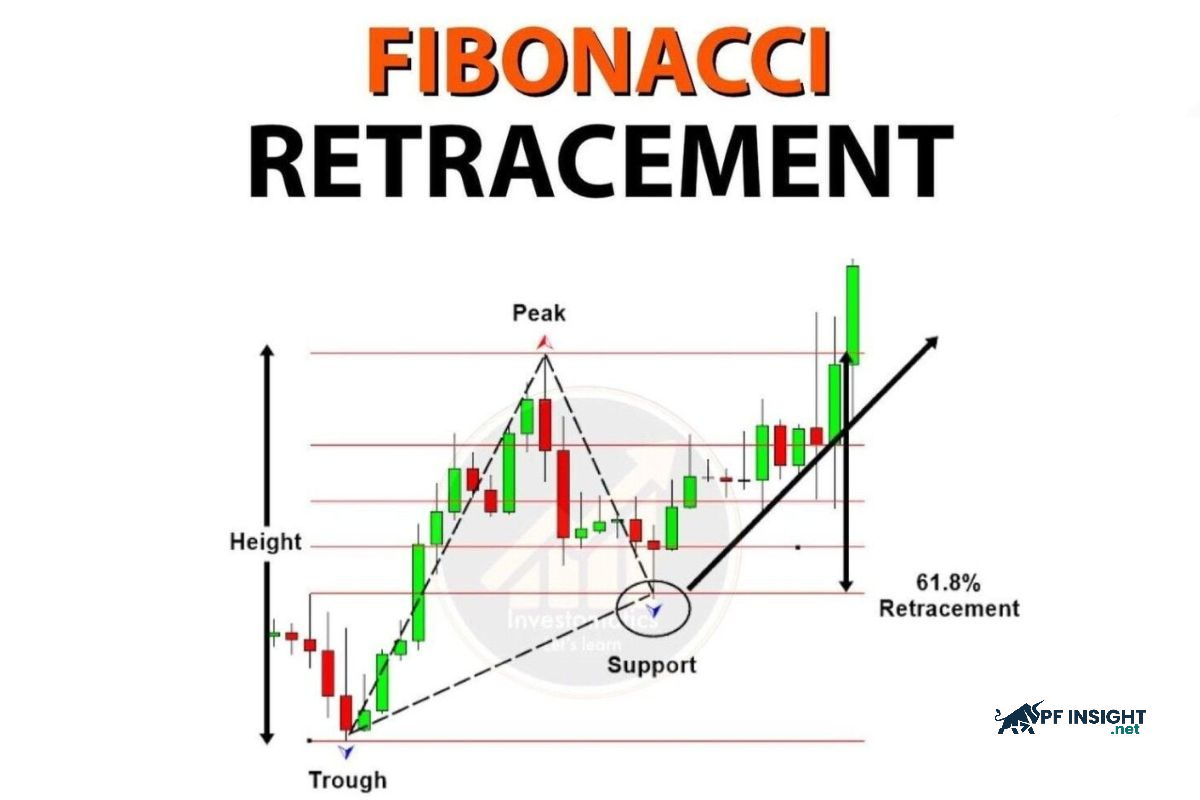
Fibonacci retracement levels act as checkpoints in a long-term price movement. Prices often pause and correct at these levels before continuing their trend. When prices react and bounce from Fibonacci levels, it signals that the main trend is still strong, providing traders with an opportunity to confirm the direction before deciding to enter a trade.
Moving average
Moving averages summarize complex price movements into a smooth line, helping traders quickly identify trends. They also act as important support or resistance levels. The two most common types of moving averages include:
- Simple Moving Average (SMA): Is the average value of the price over a specified period of time, helping to observe the overall trend.
- Exponential Moving Average (EMA): Prioritizes the most recent price data, reacts quickly to price fluctuations, and is more sensitive than SMA.
MACD (Moving Average Convergence Divergence)
MACD is a momentum indicator that measures the relationship between two moving averages of price. It is created by subtracting a 26-period EMA from a 12-period EMA, resulting in the main MACD line. A 9-period EMA, called the “signal line,” is then plotted over the MACD to provide entry and exit signals. Crossovers between the MACD and the signal line help traders identify trends and effective entry or exit points.
Ichimoku Cloud
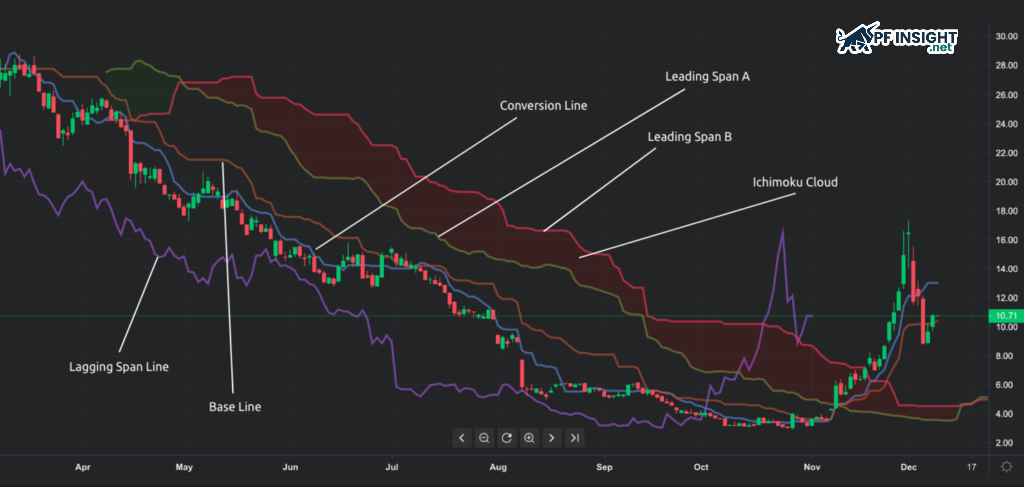
Ichimoku Kinko Hyo, also known as the Ichimoku Cloud, is a comprehensive charting system that provides a multi-dimensional view of the market. It simultaneously displays the trend, momentum, and potential support/resistance areas. The system consists of 5 main lines drawn on the chart, with the cloud (Kumo) being the most important and visual component to determine the direction of the market.
- Tenkan-sen (Conversion Line): Average of the highest and lowest levels over 9 sessions.
- Kijun-sen (Base Line): Average of the highs and lows over the last 26 sessions.
- Senkou Span A (Leading Span A): Average of Tenkan-sen and Kijun-sen, drawn 26 periods in advance.
- Senkou Span B (Leading Span B): Average of the 52-session high and low, drawn 26 periods in advance.
- Chikou Span (Lagging Span): Current closing price is shown 26 periods back to compare trends.
The distance between Senkou Span A and Senkou Span B forms the “cloud”, which acts as an important support and resistance zone for the price.
Relative Strength Index (RSI)
RSI (Relative Strength Index) is an important momentum tool that helps traders assess whether an asset is overbought or oversold. The indicator quantifies the strength of price increases and decreases, then displays the results on a scale of 0 to 100. In addition to the standard 70 (overbought) and 30 (oversold) levels, the RSI also generates strong signals through price divergence or failure swings, providing insight into an impending trend reversal.
Factors affecting the reliability of indicators
The accuracy of a trend confirmation indicator depends on many quantifiable factors in trading. The two most important factors are the current market state and the natural volatility of the asset, which directly affect the indicator’s ability to predict trends.

Market conditions
Market conditions strongly influence the accuracy of the trend confirmation indicator MT4. When the market is in a clear trend, these indicators work more effectively, because they are programmed to recognize and track the price direction. For example, MACD often gives more reliable signals during strong uptrends or downtrends, making it easier for traders to determine reasonable entry and exit points.
Conversely, in a sideways market, these indicators can easily generate false signals (whipsaws) when prices fluctuate within a narrow range. This makes trend-following strategies misleading, putting traders at high risk when attempting to apply them.
The constant change in the price of an asset
The volatility of an asset directly affects the accuracy of a trend confirmation indicator. With highly volatile assets, prices often change quickly and unexpectedly, making the indicator susceptible to false or noisy signals, reducing its effectiveness in confirming the true trend.
- High volatility: The indicator is prone to noise signals, reducing accuracy.
- Low volatility: Prices move steadily, making the indicator more reliable in identifying trends.
For example, the ATR indicator measures the volatility of prices. When the ATR is low, the market is less noisy, making trend confirmation indicators more accurate and effective in identifying the true direction of prices.
Common mistakes when applying trend confirmation indicators
Trend confirmation indicators assist traders in making decisions, but they are not 100% perfect. Over-reliance on them can lead to misjudgments of the market and inaccurate investment decisions, causing unnecessary risks.
- Relying solely on indicators while ignoring news, events or market sentiment can lead to inaccurate investment decisions and increased risk.
- Trend confirmation indicators are mainly based on past data, so traders may be slow to recognize new trends, miss opportunities, or enter orders after the market has changed.
- Indicators sometimes give false signals, causing traders to make wrong decisions, like misinterpreting information and acting on incorrect judgment.
- Using a trend confirmation indicator with default settings that do not suit your strategy can increase risk, making traders prone to mistakes and making inaccurate trading decisions.
How to use indicators to confirm trends
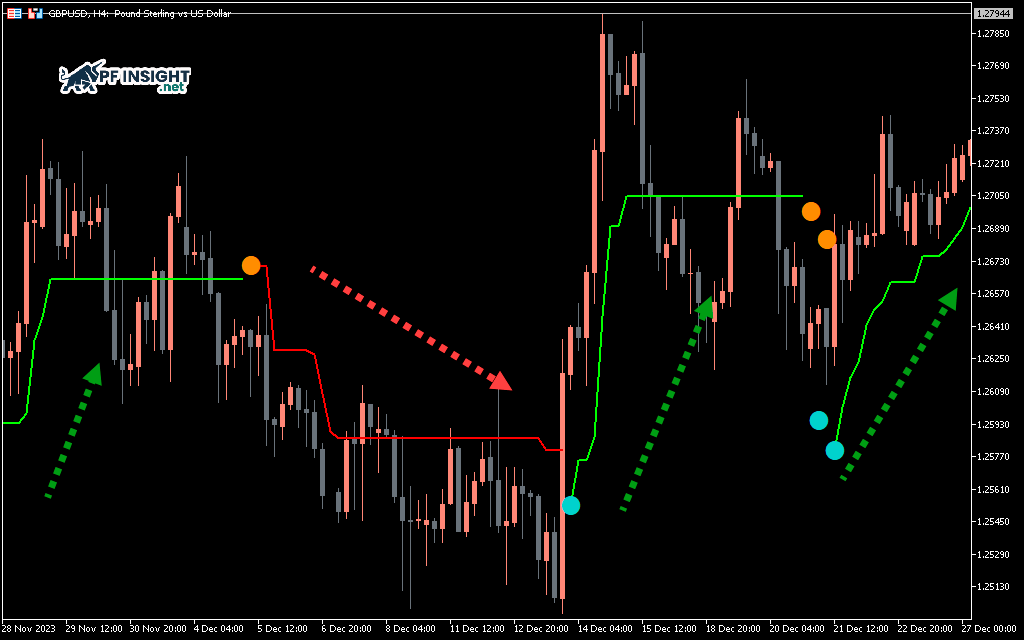
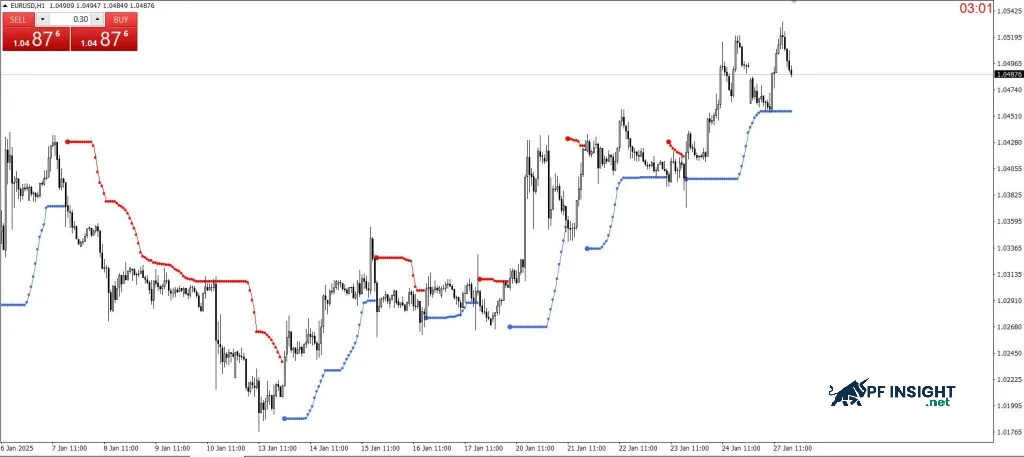
Using the trend confirmation indicator is quite easy. After installation, red and green signs will appear on the chart, helping traders quickly recognize the price direction.
- Green dot: Signals the possibility that the price is in an uptrend.
- Red dot: Indicates that the market may be heading down.
- A series of consecutive dots of the same color represents a stronger and more stable current trend.
To Buy and Sell when trading trend confirmation indicator as follows:
Buy Entry
- Check for potential upside moves through price action or additional technical analysis tools.
- Watch the indicator and you will see a green dot appear on the chart.
- Execute BUY order when green dot signal appears.
- Place stop-loss below the nearest low to manage risk.
- Close the order when the indicator turns red or the price action shows a weakening trend.
Sell Entry
- Verify the discount using a tool or analysis method you trust.
- Wait for the signal to appear as a red dot on the indicator.
- Open SELL order when downtrend is confirmed.
- Place stop-loss above the nearest peak to limit risk.
- Close the order when the indicator shows a green dot or the price action shows that the trend is about to reverse.
Tips use trend confirmation indicator effectively
To use trend confirmation indicators effectively, traders need to adopt a planned approach, including backtesting strategies, establishing clear risk management rules, and incorporating other indicators. These three factors ensure that indicators are applied consistently and with sound basis, thereby improving the quality of trading decisions.
Backtesting
Backtesting is the process of applying trend confirmation indicators to past data to evaluate their predictive ability. This is an essential step for traders to determine the effectiveness of the indicator in different market contexts, and to recognize its strengths and limitations before putting it into real trading.
The necessary steps to perform effective backtesting include:
- Choose historical data: Use a diverse set of price data, covering different market periods.
- Define your testing period: Choose a time frame that truly reflects your trading style and strategy goals.
- Set up indicator parameters: Adjust the values of the trend confirmation indicator to suit the strategy you want to test.
- Measure performance: Analyze results based on metrics such as win rate, net profit, drawdown and Sharpe ratio to evaluate strategy quality.
Effective capital management
An important factor when using trend confirmation indicators is to combine them with a suitable risk management plan. Thanks to that, traders can control the loss level in each transaction, maintain the safety of the account and optimize trading efficiency in the long term.
To manage capital effectively, traders do the following:
- Calculate trading volume: Decide how much capital to use for each order according to your account size and acceptable risk level.
- Stop-loss setting: Set a stop-loss at a level that shows a clear change in trend, based on signals from the applied indicators.
- Set profit target: Determine the expected profit level based on the strength of the trend and the signals provided by the indicators.
- Monitor and adjust: Regularly review strategies and risk levels to ensure they remain aligned with market signals and are performing effectively.
Use additional indicators to strengthen the signal
Trend analysis on different time frames
An effective strategy for trend confirmation is to apply the same indicator across multiple timeframes. This method allows traders to see both the overall market picture and short-term fluctuations, thereby accurately assessing the strength and direction of the trend. Combining information from multiple timeframes also reduces the risk of false signals and improves decision-making when entering or exiting a trade.
- Short-term timeframes: Usually 1–15 minute charts, helping traders capture immediate price movements and quick trading opportunities.
- Medium-term timeframe: Includes 1–4 hour charts, providing a more comprehensive view of the current trend and its strength.
- Long-term timeframe: Usually a daily, weekly or monthly chart, which helps assess the overall market landscape and determine long-term direction.
By looking at the same indicator, such as MACD, on weekly, daily, and hourly time frames, traders can compare the short-term trend with the overall long-term trend. This approach helps determine whether temporary fluctuations are consistent with and support the main trend, thereby improving the accuracy of trading decisions.
Indicator confluence
Using converging indicators not only helps confirm the main direction of the market but also reduces noise signals. When multiple indicators give similar signals, traders have a more solid basis for entering orders and making accurate trading decisions.
- Trend indicator: Moving average (MA), helps to identify the main direction of the market.
- Momentum indicator: RSI, assesses the speed of price movements and predicts the possibility of reversal.
- Volume Indicator: Analyzes trading volume to determine the strength of a price trend.
To optimize performance, experienced traders always look for “confluence” between different indicators before placing an order. For example, a sell signal is considered reliable when a trend line is broken, accompanied by a negative divergence of RSI and a sharp drop in Trading Volume, indicating that selling pressure is overwhelming the market.
Conclude
In short, the trend confirmation indicator is an indispensable tool that helps traders confirm the strength and direction of market trends, thereby minimizing risks and increasing the chances of success. PF Insight finds that combining this indicator with multi-timeframe analysis will be the key to achieving more accurate and optimal trading decisions.


