
Momentum indicators are technical tools that help traders assess the strength and speed of price changes, thereby determining the momentum of the current trend. Understanding and applying these indicators correctly helps traders grasp favorable entry points and avoid noise signals. This article will analyze what momentum indicators are, how to use them and trading strategies.
- How to install indicators on MT5 – Step-by-step guide
- What is a pullback in trading and why it matters
- MT4 account management in 2025 – What every trader should know
What are momentum indicators?
Momentum indicators are technical analysis tools that help determine the speed of price movements over a certain period of time. They provide information about the strength of a trend, allowing traders to assess market momentum. However, these indicators do not indicate price direction, but only reflect the speed of price movements.
In technical analysis, momentum is considered a factor that reflects price changes. Therefore, traders often use this indicator to detect signals about the start or end of a trend. These indicators are based on short-term price volatility and work well in both trending and consolidation markets.
Formula for calculating momentum indicator
Nowadays, traders do not need to calculate the momentum indicator manually, as most trading platforms and analysis software have this tool available. However, understanding the components and variables in the calculation helps traders to more accurately assess the trend, the strength of the momentum and make more effective investment decisions.
The formula for calculating momentum indicators is as follows:
MOM = (Current closing price ÷ Closing price of a previous period) x 100
Popular types of momentum indicators
Below are momentum indicators that are widely used in technical analysis. Each type of indicator provides a different perspective on price behavior, helping traders assess the strength of the trend, the level of volatility, and early identification of the possibility of a reversal. As a result, traders can make more accurate decisions when entering the market.
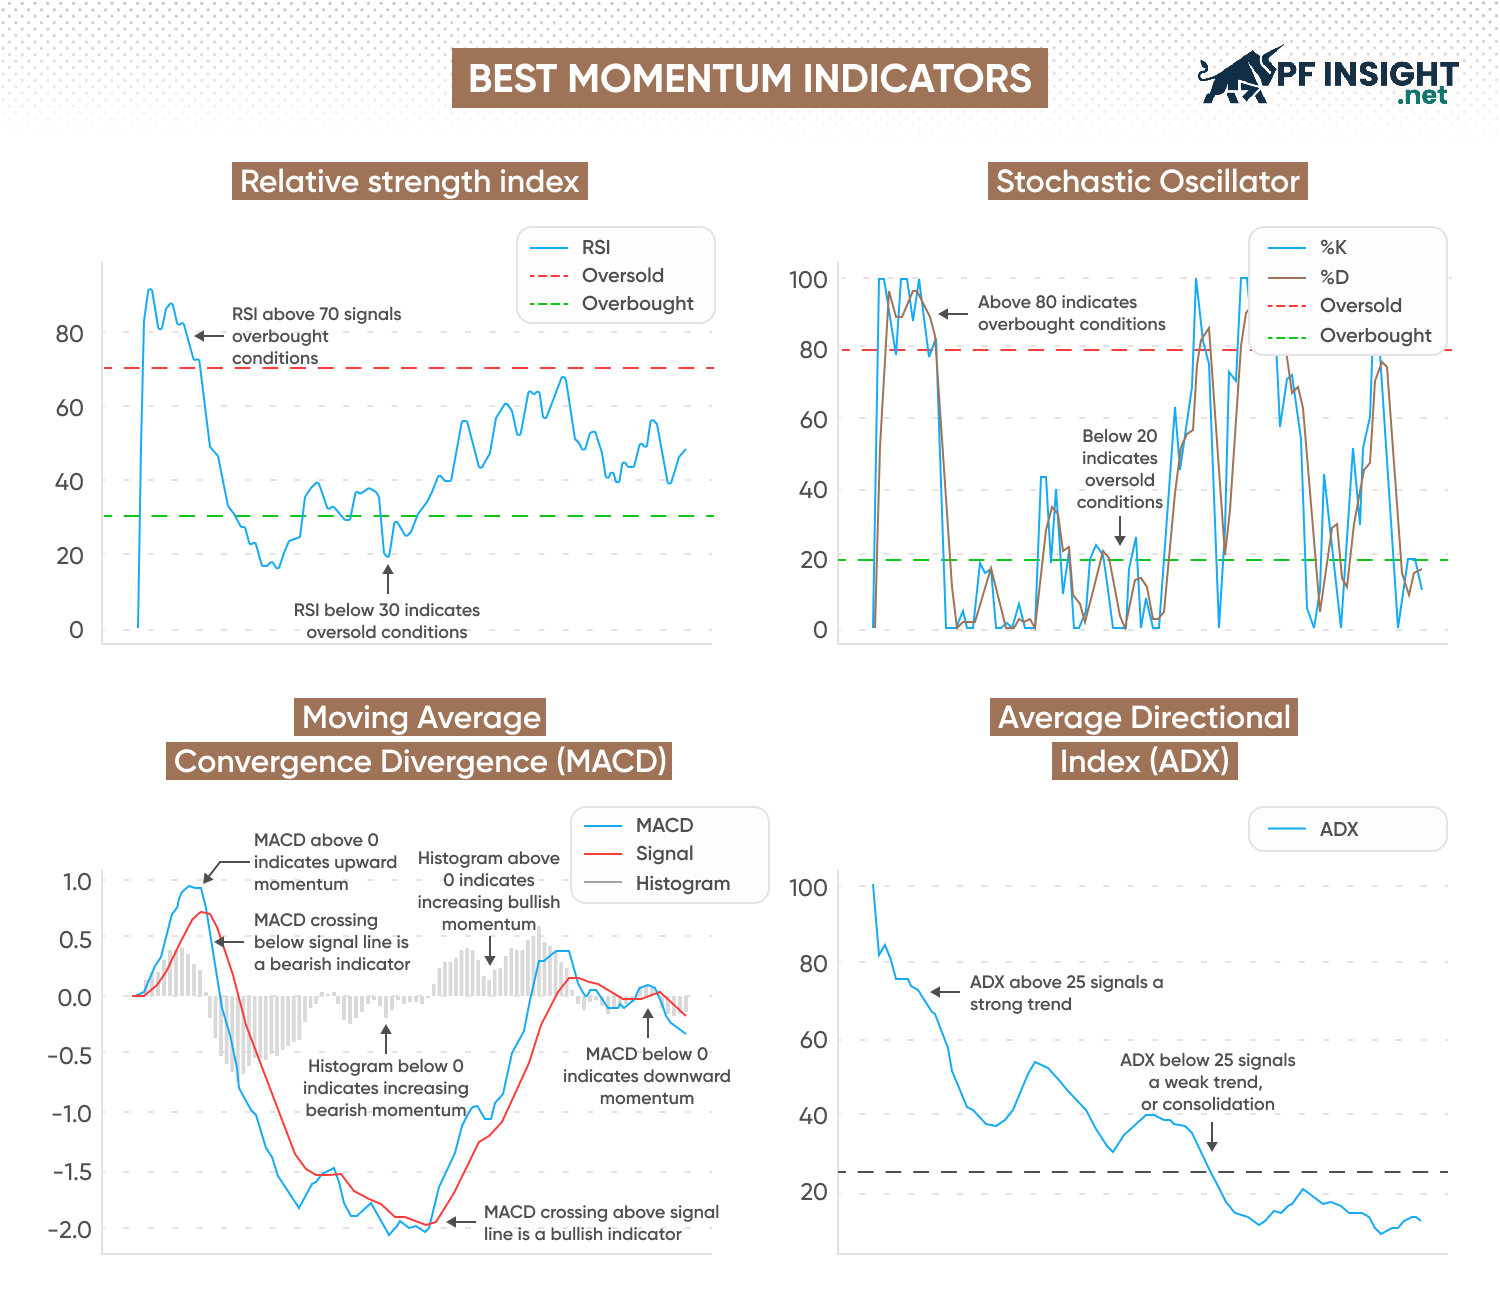
Relative strength index (RSI)
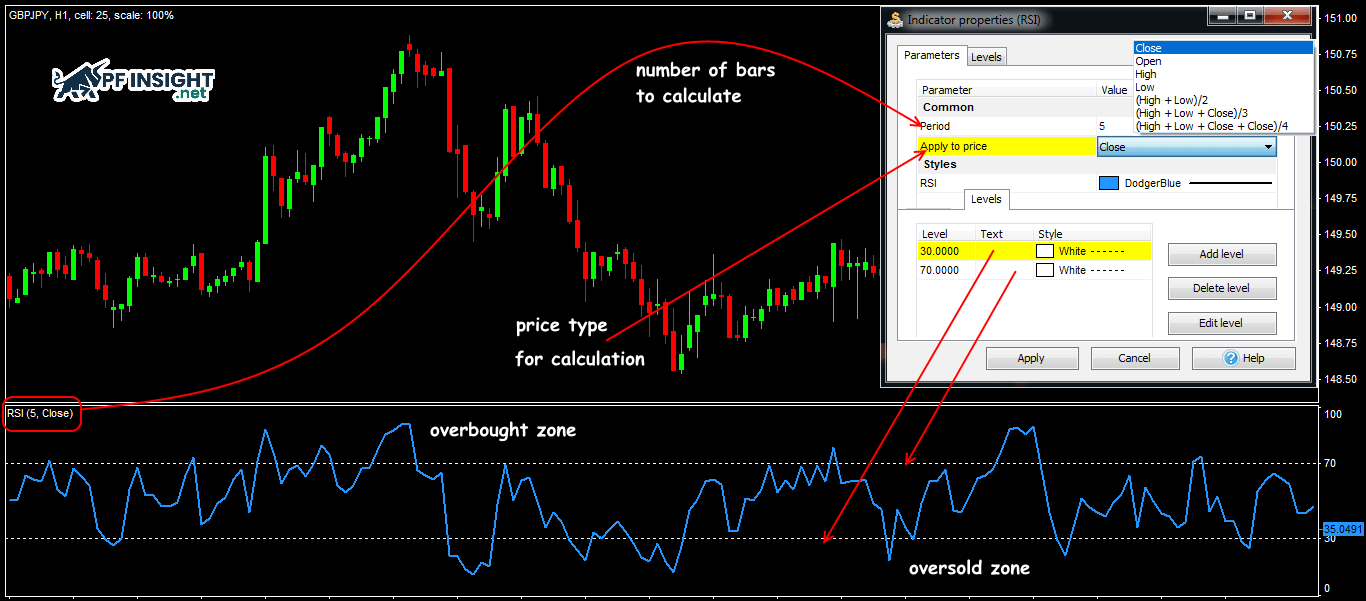
RSI is one of the most popular momentum indicators, designed to gauge the strength of recent price movements. It compares the average increase and decrease over a given period, usually 14 days. RSI ranges from 0 to 100, helping traders spot overbought, oversold, or divergence signals that signal a possible trend reversal.
- Trading signals: When RSI is above 70, the market is generally considered to be overbought, while below 30 indicates oversold conditions. These are warning signals of a possible correction or reversal in price trends.
- Advantages: RSI is a simple yet powerful tool that helps traders identify when prices have moved too far away from equilibrium. This indicator is especially useful in identifying reversal signals and reinforcing existing trends.
- Disadvantages: Potential to generate noise signals when the market is in a strong trend
Moving average convergence divergence (MACD)
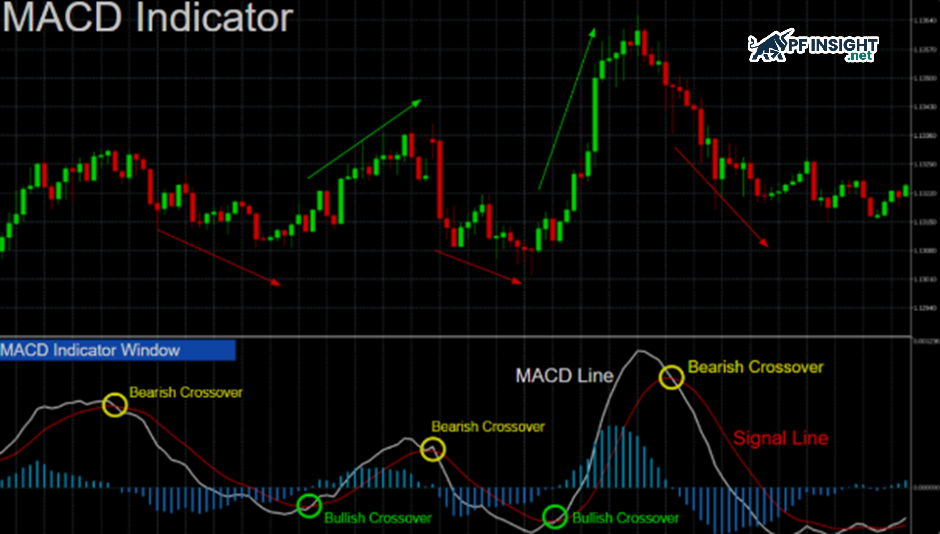
MACD, one of the most powerful momentum indicators, is classified as a trend. It shows the relationship between two moving averages of prices, helping to determine the strength and direction of the current trend. When the MACD lines cross, it can signal a change in market momentum.
Typically, the MACD is formed by taking the difference between the 12-period EMA and the 26-period EMA. A 9-period EMA of the MACD itself – called the “signal line” – is then added to the chart. The intersection of these two lines helps traders determine the right time to open a buy or sell order according to the market trend.
- Trading signal: When the MACD line crosses the signal line, it can be a sign of a change in momentum. The Histogram illustrates the strength of this change.
- Advantages: This tool combines both trend and momentum elements, helping traders identify market movements early, while making it easy to observe and analyze.
- Disadvantages: Tends to react slowly during periods of strong market changes
Stochastic oscillator
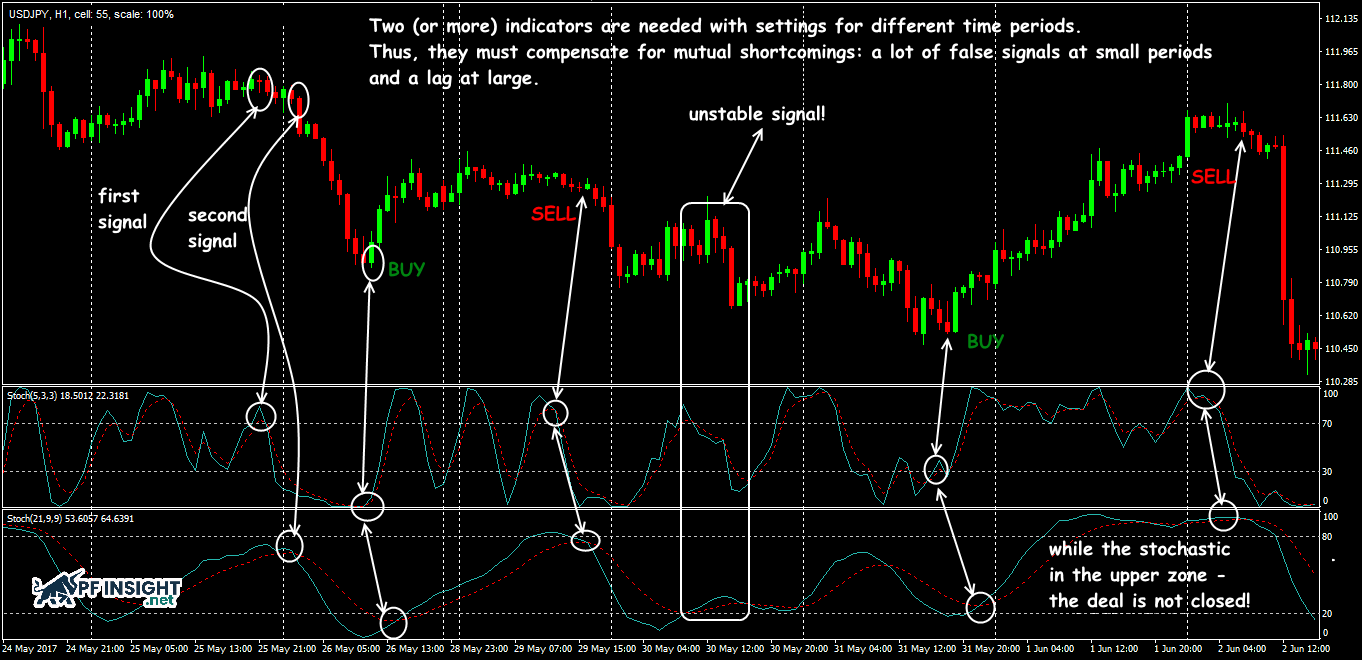
The Stochastic oscillator is a popular momentum indicator that measures the current closing price relative to the price range over a given period, usually 14 periods. It focuses on the speed and momentum of price movements rather than volume. Traders often use the Stochastic to identify overbought and oversold conditions and to predict potential trend reversals in the market.
- Trading signal: When the Stochastic indicator is above 80, the market is considered overbought, conversely, below 20 indicates oversold condition.
- Advantages: Useful in determining when to enter an order when the market is volatile
- Disadvantage: Easy to create noise signals when the market is maintaining a clear trend
Average Directional Index (ADX)
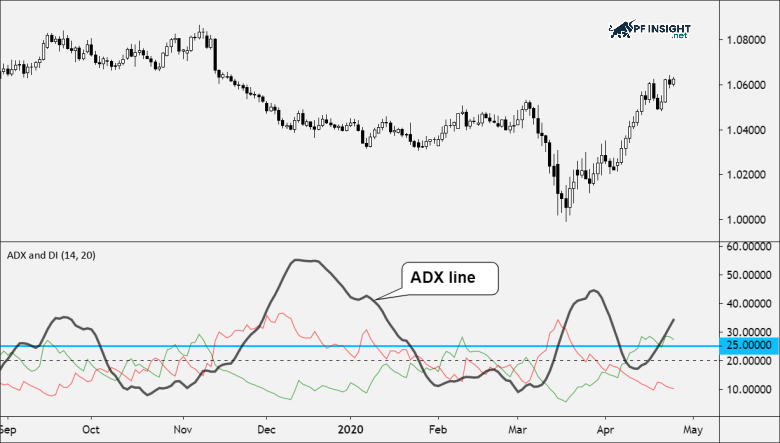
ADX is considered one of the most popular trend strength indicators, helping to assess the intensity of a market trend. This indicator consists of two components: the Positive Directional Indicator (+DI), which reflects the strength of an uptrend, and the Negative Directional Indicator (−DI), which represents a downtrend. The crossover between these two lines provides important signals that help traders determine the appropriate timing to buy or sell.
- Trading signal: When the ADX value exceeds 20 or 25, it indicates that a trend is forming, conversely, below 20 indicates the market lacks momentum or is moving sideways.
- Advantages: Helps traders eliminate noise signals in weak markets and acts as an effective filter for trend trading strategies.
- Disadvantage: Does not determine the specific direction of the trend (up or down), only reflects its strength.
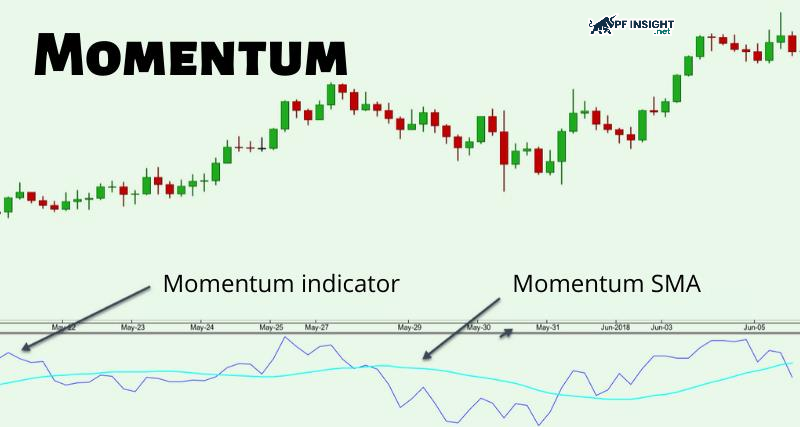
Momentum oscillator (MOM)
Momentum indicator (MOM), also known as momentum oscillator, is used to assess the rate of change of price over a specified period.
- Trading signals: When momentum is increasing, the trend shows strength, however, if momentum weakens while price continues to move up, a reversal may be possible.
- Advantages: Simple tool to determine the direction and intensity of price movements, quick response to the market, suitable for short-term trading.
- Disadvantages: Does not provide defined thresholds for overbought or oversold conditions.
How to read momentum indicators
Traders can use momentum indicators to identify overbought and oversold zones, detect signal crossovers, assess trend strength, and identify price divergences.
Overbought and oversold conditions
Some momentum indicators such as RSI or Stochastic oscillator often oscillate within a certain range, allowing traders to identify when an asset price may fall into an overbought or oversold state, thereby predicting the possibility of a correction or trend reversal. Stochastic oscillator (STO) is a tool that helps identify overbought and oversold areas of the market. When the price exceeds 80, the market is considered overbought, conversely, below 20 indicates oversold. When the %K line intersects the %D line in this area, it signals the possibility of an upcoming trend reversal.
Momentum crossovers
Some momentum indicators incorporate a signal line or moving average to confirm the direction of the momentum. MACD is a typical example, widely used to identify changes in trend strength.
- Bullish signal: When the MACD line crosses above the signal line, this reflects that the bullish momentum is strengthening.
- Bearish signal: When the MACD line falls below the signal line, it is a sign that momentum is weakening and a downtrend may be forming.
- MACD Histogram: Shows the distance between the MACD line and the signal line, helping traders observe fluctuations and recognize possible momentum changes in the market.
Assessing the strength of the trend
Indicators like ADX are designed to gauge the strength of a trend, rather than determining whether the trend is up or down in the market.
- ADX above 25: Shows that the market is in a clear trend, whether up or down.
- ADX below 20: Reflects a weak trend or the market is in a sideways phase, lacking strong moving momentum.
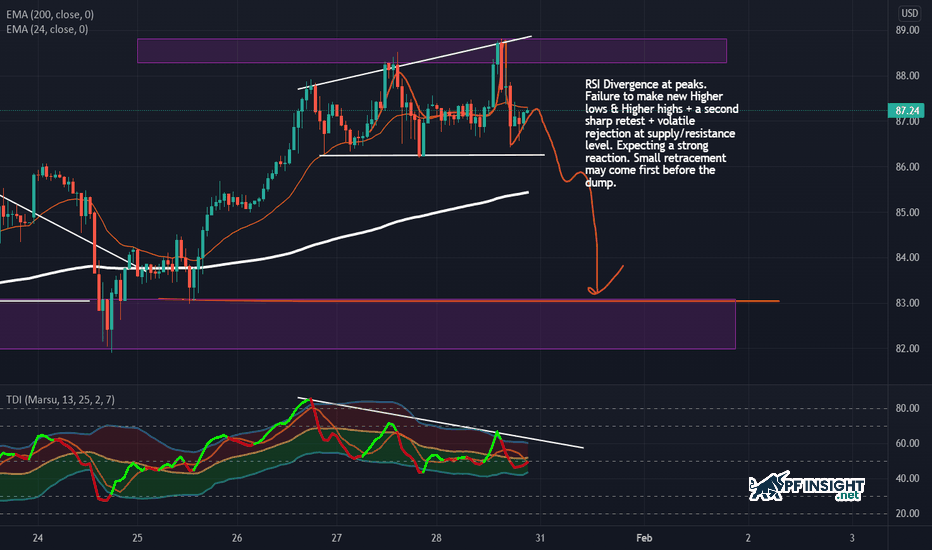
Price divergence phenomenon
Divergence forms when price action and momentum indicators no longer move in the same direction. This phenomenon is considered an early warning signal of a possible trend reversal, however traders should wait for further confirmation before making a trading decision.
- Bullish divergence: When the price forms a lower low but the momentum indicator forms a higher low, this indicates that selling pressure is weakening and an uptrend may be about to form.
- Bearish divergence: When price makes a higher high while the momentum indicator makes a lower high, it is a signal that buyers are losing strength and a bearish reversal is likely.
How to apply momentum indicators to trading
Momentum indicators help traders assess the strength of a trend and find the right time to enter or exit a trade. Here is a guide to effectively applying them in trading.
- Establishing an investment strategy: Traders need to determine in advance whether they will trade long-term trends or short-term fluctuations. Day traders or short-term swing traders can use the Stochastic Oscillator to identify potential reversal points. Meanwhile, long-term trend traders can use the MACD to confirm changes in momentum, helping them make more effective entry and exit decisions.
- Choosing the right indicator: Each technical indicator has its own function to help traders analyze the market. Stochastic Oscillator and RSI help identify overbought or oversold areas, ADX assesses trend strength, MACD reflects momentum changes, while Momentum Indicator and ROC measure the speed of price changes over time, providing deeper insight into the strength and trend of market movements.
- Verifying trading signals: Momentum indicators provide important signals that help traders determine when to enter and exit a trade. For example, a MACD or RSI crossover above 50 may indicate increasing bullish momentum. Conversely, a bearish divergence or a weakening ADX may signal a possible decrease in buying pressure. Overbought and oversold zones indicate a potential reversal, but in a strong trend, prices may continue to move despite these signals.
- Risk control in trading: Trend trading is often accompanied by high volatility, so risk control is very important. Use stop-loss orders to limit losses, set take-profit orders to protect potential profits, and adjust stop-loss orders when the trend is favorable to keep profits safe during market movements.
- Test your strategy: Before making a real trade, test your momentum strategy through backtesting or a demo account. This will help you optimize your indicator settings and choose the right timeframe, and ensure that the strategy suits your trading style and current market conditions, reducing unnecessary risk.
Advantages and disadvantages of momentum indicators
For professional traders, understanding the speed and strength of price movements is very important. Momentum indicators provide a visual view of the current market rhythm, helping to make timely decisions. However, they also have limitations and do not always accurately reflect trends or turning points.

Advantage
- Assessing trend strength: Momentum indicators help traders accurately assess the strength of a trend, whether bullish or bearish. By observing the speed of price movements, traders can distinguish sustainable trends from temporary fluctuations. This allows them to take advantage of strong trends and avoid participating in weak movements, minimizing the risk of going against or following unclear trends.
- Overbought/Oversold signals: Popular momentum indicators like RSI and Stochastic Oscillator help identify overbought or oversold areas in the market. These areas indicate that the price may move too far in one direction, potentially leading to a correction. Recognizing these signals allows traders to avoid entering orders at high-risk levels, optimize trading decisions, and manage capital more effectively.
- Identifying a possible reversal: Momentum indicators are effective tools for identifying a possible trend reversal. When divergence occurs, meaning the indicator moves in the opposite direction to the price, it is often a warning sign that the market may change direction soon.
- Increased trading discipline: By applying momentum indicators in their analysis, traders can build a more disciplined trading approach. These tools help limit decisions based on emotions or short-term price fluctuations, and instead focus on market movements.
- Testing your trading strategy: While each momentum indicator is useful on its own, its true value comes when combined with other technical tools. They help confirm signals from moving averages or trend lines, creating a more accurate and reliable trading strategy.
Disadvantages
- Noisy signals: Momentum indicators can sometimes produce inaccurate signals, especially when the market is volatile. Rapid price movements can cause false overbought or oversold readings, leading traders to react prematurely and miss opportunities or execute ineffective trades.
- Latency: Momentum indicators are based on historical data, reflecting previous price movements. As a result, they may not be able to detect sudden changes in market sentiment, leading to traders missing breakout opportunities or getting stuck in the wrong trend.
- Highly dependent on configuration parameters: Momentum indicators are heavily influenced by settings such as timeframes or moving average periods. These settings determine the sensitivity and the signals that appear. Traders should experiment and understand the impact of each parameter to use the indicator effectively and in accordance with their trading style.
- Limited ability to assess market conditions: Momentum indicators mainly reflect price movements without considering other factors such as economic data or fundamental analysis. Relying solely on them can lead traders to make inaccurate trading decisions or miss important market context.
Conclude
Thus, momentum indicators are important tools to help traders assess the strength and speed of price movements, identify trends and potential reversal points. However, for optimal efficiency, PF Insight encourages traders to combine risk management, market context and other technical tools in trading.


