In the financial market, prices never move in a straight line but always fluctuate continuously. This fluctuation creates both opportunities and challenges for traders when finding appropriate entry and exit points. In particular, pullback is a common phenomenon, representing a temporary adjustment in the main trend. So what is a pullback? Let’s pfinsight.net find out more in the following article.
- MT4 account management in 2025 – What every trader should know
- How to choose reliable trading signals for your strategy
- How to add custom indicators to MT5: step-by-step setup guide (2025 update)
What is a pullback?
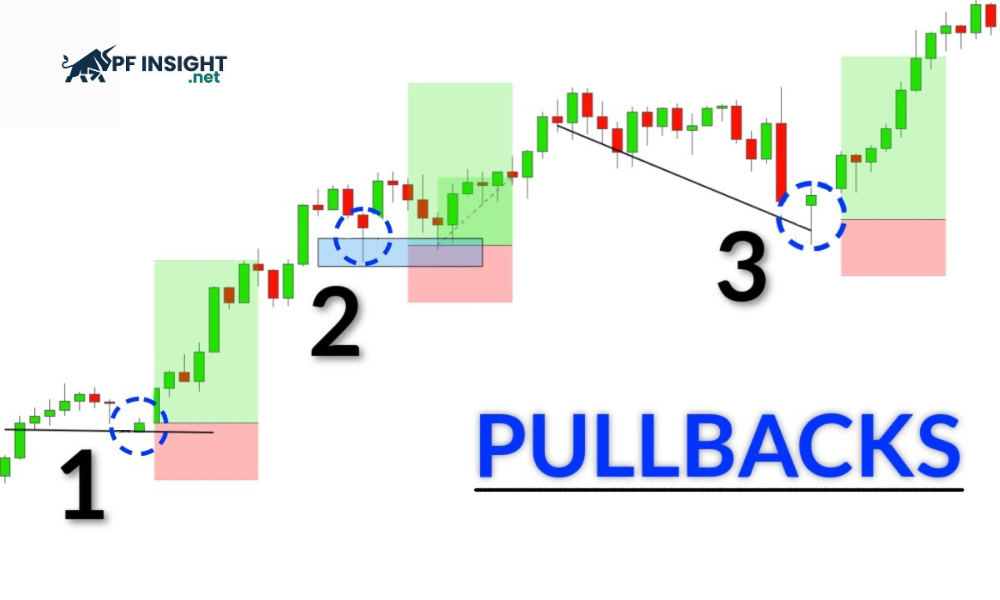
Pullback is a temporary price movement against the main trend, which can be a decrease in an uptrend or an increase in a downtrend. This is considered a short-term adjustment phase, reflecting the balance of supply and demand, not a trend reversal signal.
Typical signs of a pullback:
- Pullbacks are usually short-lived, lasting a few days to a few weeks.
- This phenomenon appears within a larger overall trend which can be either up or down.
- It gives traders the opportunity to enter the market at more attractive prices: Buy when the price corrects in an uptrend, or sell when the price retraces in a downtrend.
Common types of pullbacks in trading
In the market, traders often encounter different types of pullbacks and analyze them to find potential entry points. Below are the common types of pullbacks:
- Shallow pullbacks: Shallow pullbacks are short-term and slight price corrections, usually below 38.2% of the initial price. This type of pullback reflects the strength of the main trend, giving traders the opportunity to enter early as the trend continues to develop.
- Deep pullback: This is a strong correction phase, usually retracing about 50% to 61.8% of the previous price movement according to Fibonacci. This type of pullback creates an opportunity to enter orders at good prices, but has a higher risk because it can reflect a temporary weakening of the main trend.
- Steady pullback: A phenomenon where prices adjust slowly and steadily over time. They often create recognizable patterns such as price channels or flags, helping traders identify clear entry points to take advantage of opportunities as the main trend continues to develop.
- Sharp pullback: A period of strong and rapid price correction, moving in the opposite direction of the main trend. This phenomenon makes it easy for inexperienced traders to be eliminated from the market, while professional traders can take advantage to enter orders at attractive price levels before the main trend returns.
- Volatile pullback: Occurs when the market is highly volatile, prices move erratically with consecutive sharp increases and decreases. This type of pullback makes trend analysis complicated, traders should use risk management strategies to protect capital in trading.
Why do price pullbacks commonly appear?
Understanding what a pullback is helps traders realize that it is a natural phenomenon of the market, not a bad sign. Pullbacks occur due to many factors such as profit taking, market psychology or economic news. Understanding the causes helps traders predict better and avoid making hasty decisions.

Profit-taking actions from traders and large institutions
A common cause of pullbacks is profit-taking after sharp increases or decreases. Once the price has reached its desired level, many traders and financial institutions close their positions to realize profits. This counter-trend selling or buying creates a temporary correction before the main trend resumes.
For example, in an uptrend, when the price of a currency pair or stock rises sharply, many traders will sell to take profits. This action causes the price to temporarily correct downwards, opening up new buying opportunities for traders waiting for a more favorable entry point.
Liquidity and order matching in the market
Pullbacks are sometimes caused by liquidity, or the ability of a market to execute orders quickly. When large volume buy or sell orders appear, prices may fluctuate against the current trend for a short time before returning to equilibrium.
For example, when a financial institution executes a large sell order during an uptrend, the price may temporarily correct downwards to allow the market to absorb the order. If buying pressure remains dominant, the uptrend will usually resume soon.
Identify important support and resistance zones
Understanding what a pullback is helps traders realize that it often occurs when prices approach strong support or resistance zones. These are important psychological levels where the market often reacts before resuming the main trend.
When the market is in an uptrend, prices often make a short-term correction to test the support zone before continuing to move up. Conversely, in a downtrend, prices may rebound slightly to touch the resistance zone before resuming the main downtrend.
Temporary fluctuations in investor sentiment
Market prices always respond to changes in supply and demand, news and crowd psychology. When there is new information or investor psychology fluctuates, buying and selling forces are temporarily unbalanced, causing short-term price adjustments and pullbacks within the overall trend.
For example, a company that announces strong earnings but gives a conservative growth forecast may cause investors to sell temporarily, causing the stock price to fall slightly before recovering. Similarly, in the Forex market, unexpected news such as a Central Bank statement can cause short-term volatility without changing the main trend.
Robot trading and high frequency strategies
In modern markets, pullbacks are often associated with the impact of algorithmic trading and HFT systems. These algorithms automatically execute orders based on predetermined conditions, creating rapid price swings. When large volumes of orders are triggered simultaneously, they can cause short-term pullbacks in the main trend.
Pullbacks are an inevitable part of price movement, but understanding what a pullback is helps traders distinguish between a trend continuation signal and a reversal warning. To take better advantage of opportunities, traders need to learn how to accurately identify pullbacks through technical indicators and price action analysis.
Guide to identifying pullbacks in trading
To identify a pullback, traders need to closely observe price action within the overall trend to distinguish between a temporary correction and a potential reversal. Combining market structure analysis, technical indicators, and price action signals helps make more accurate decisions.

Observe price action
A pullback is considered a temporary correction in the main trend, occurring in the opposite direction but without breaking the important support or resistance zones. An uptrend is still confirmed when the price makes higher highs and lows after the correction. Conversely, in a downtrend, a series of lower highs and lows continues to reinforce the downtrend.
For example, in an uptrend, if the price corrects but remains above the most recent low, it is often a sign of a pullback. Conversely, if the price breaks below the previous low, this may indicate that the uptrend has weakened and a reversal is likely to occur.
Using MA indicator
When trying to understand what a pullback is, traders often use moving averages to confirm the trend. MAs act as dynamic support or resistance zones, helping to differentiate between short-term corrections and true trend changes. Typically, a 50-period MA is used for short-term pullbacks, while a 100-period MA reflects longer-term trends.
For example, in an uptrend, when the price corrects to the 50-period moving average and bounces back, it is usually a sign of a strong pullback. However, if the price breaks the moving average with strong selling pressure, it indicates that the current trend is weak and a reversal is likely.
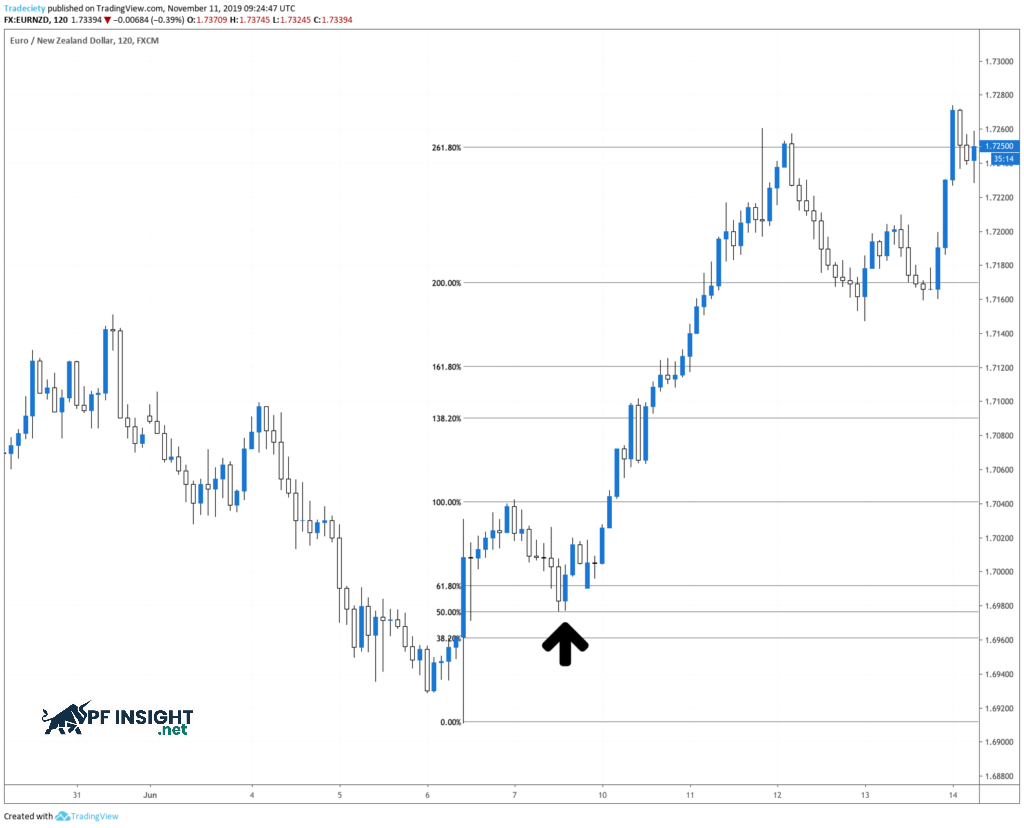
Take advantage of fibonacci retracement zones
Fibonacci retracement is a popular tool that helps traders identify potential price corrections within a major trend. By measuring the distance of the most recent price move, traders identify important levels such as 38.2%, 50%, and 61.8%. The 38.2% level represents a strong trend with only a small correction, 50% is often considered a potential area to open a position, while 61.8% signals a deep correction and may lead to a reversal if the trend fails to sustain.
For example, if a pair rises from 1.2000 to 1.3000, the price may correct to around 1.2500 – which represents the 50% retracement level, acting as potential support. However, if the price falls below the 61.8% area, it indicates that the bullish momentum is weakening and the possibility of a reversal increases.
Observe the rejection candlestick pattern
Candlestick patterns help identify the reaction of buyers and sellers during a pullback. A Hammer or Pin Bar candlestick usually shows a return of buying pressure in an uptrend. Conversely, a Bearish Engulfing or Shooting Star pattern shows strong selling pressure, signaling the possibility of further price declines after the pullback.
For example, in an uptrend, when the stock price corrects to a strong support zone and a Hammer candlestick appears with high trading volume, it reflects the return of buying pressure. This signal is often seen as a sign of a reasonable pullback opportunity.
Volume analysis
In the process of understanding what a pullback is, trading volume is a factor that helps investors determine the nature of price movements. A pullback usually occurs when volume decreases, reflecting a pause in the main trend. Conversely, if volume increases sharply along with price movements, it can be an early sign of a trend reversal.
For example, when a cryptocurrency corrects down on low volume but quickly recovers with a sharp increase in volume, it indicates that the uptrend is still dominant and the decline is just a pullback. Conversely, if volume spikes during a downtrend, it could be a warning signal of an impending trend reversal.
Identify and remove noise signals
Misreading pullback signals can be very risky for traders, especially when the market turns sharply. For example, a trader expects the price to bounce after a pullback, but instead, the price breaks a key support level, signaling a deeper downtrend. To avoid mistakes, confirm the signal by combining the pullback with price action and technical indicators before entering the official order.
5 effective pullback trading strategies
To trade effectively, investors need to understand what a pullback is and how it works within the main trend. Pullbacks provide an opportunity to enter at a more reasonable price, but without careful analysis and a clear strategy, traders can easily mistake a short-term correction for a real trend reversal.
Trendline pullback strategy
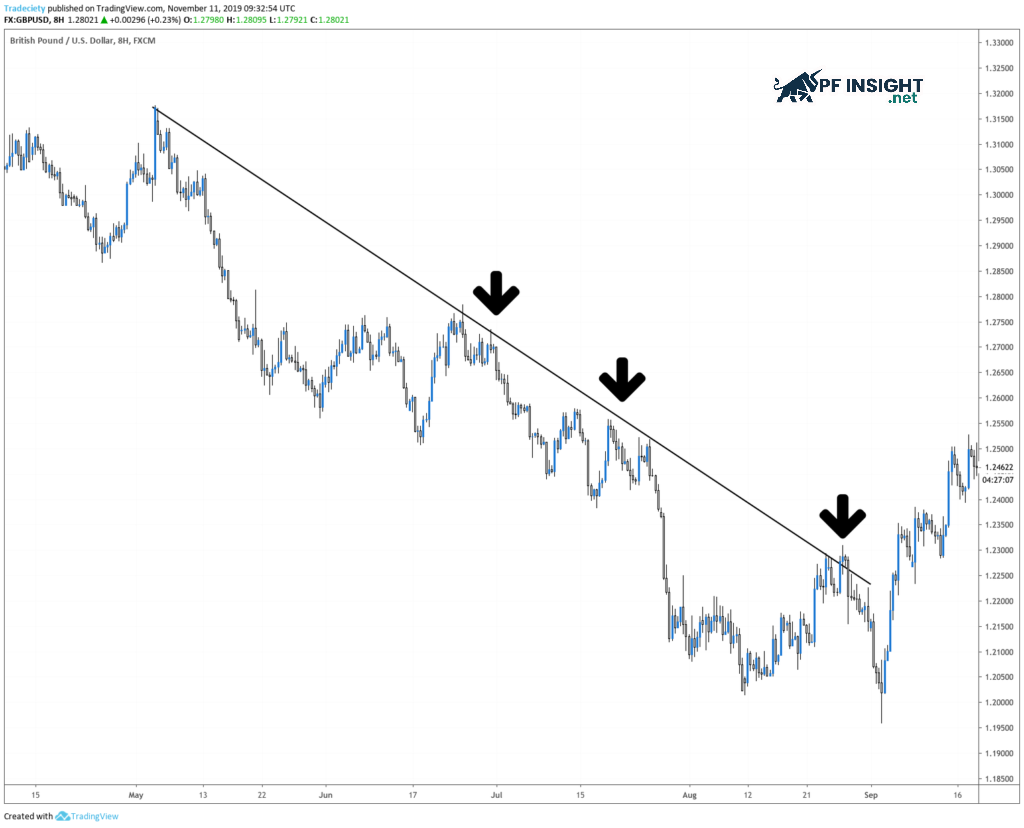
Trendlines are an important tool for traders to identify the main direction of the market. They also act as dynamic boundaries where pullbacks usually end before prices continue in the main trend. A perfect trendline connects at least three important peaks or troughs, creating a reliable zone to identify potential price retracements.
- Entry point: Make a buy or sell trade right at the moment the price retraces to touch the trend line and a rejection candlestick pattern appears to confirm the reversal.
- Stop loss: Stop loss is placed just below the trend line when you place a buy order in an uptrend and just above the trend line when selling in a downtrend.
Support and resistance pullback strategy
Important support and resistance zones are often where prices react strongly, creating opportunities for temporary reversals. In an uptrend, prices often return to support before moving up, while in a downtrend, prices may retrace to resistance before continuing their decline, helping traders identify potential entry points.
- Entry point: Open an order when the price approaches an important support or resistance zone and a confirmation signal from a reversal candlestick pattern appears, such as a Hammer, Pin Bar or Engulfing.
- Stop loss: In an uptrend, place just below the important support zone, in a downtrend, place above the resistance zone to limit risk.
Pullbacks combined with moving averages
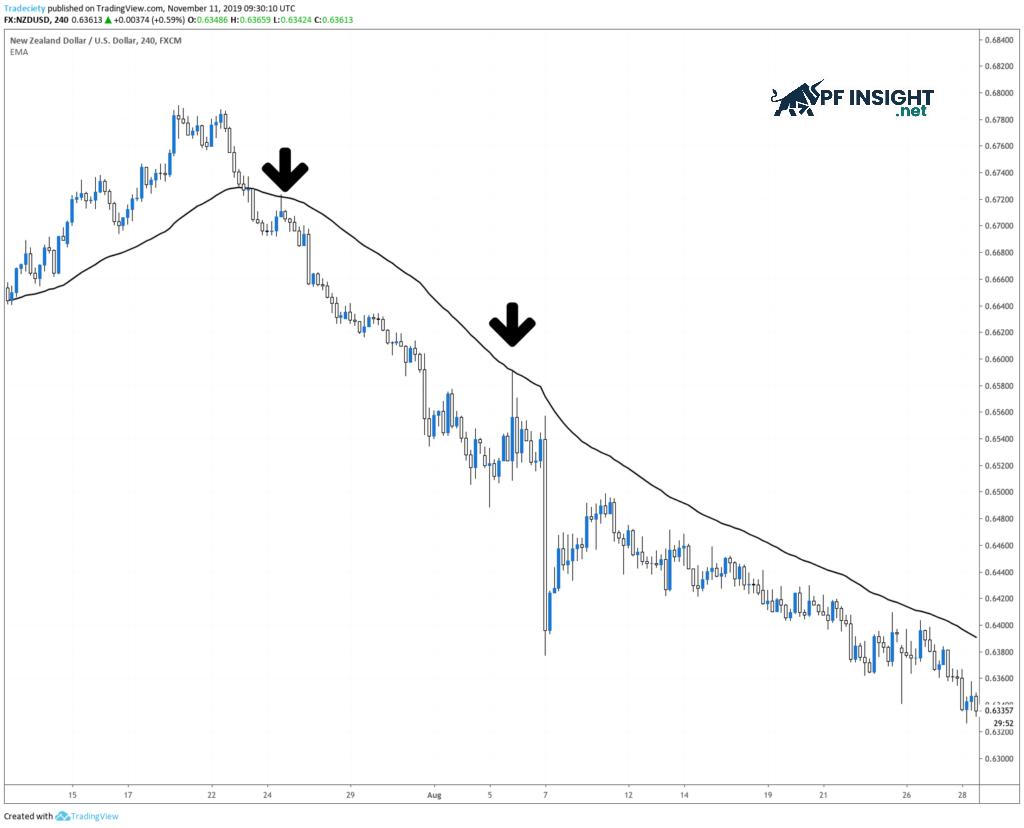
Moving averages act as dynamic support and resistance zones, providing signals for potential entry points when prices correct. In an uptrend, traders expect prices to retrace to important moving averages like the 50-period or 100-period before continuing their upward move. Conversely, in a downtrend, prices often retrace to their moving averages before continuing their downward momentum, helping traders identify safer trading opportunities.
- Entry point: Open position when price approaches moving average line and trend confirmation signal appears (Hammer or Pin Bar candle shows buying pressure returning in an uptrend).
- Stop loss: In an uptrend, traders open buy orders when the price is close to below the moving average line, in a downtrend, sell orders are placed when the price approaches above the moving average line.
Breakout and retest strategy
A breakout pullback occurs when the price breaks resistance in an uptrend or support in a downtrend, then comes back to test the breakout level before continuing in the main trend. In an uptrend, when the price breaks resistance and comes back to test as new support, the trend continues up. Conversely, in a downtrend, the price breaks support, retests as new resistance before continuing further down.
- Entry point: Open an order when the price returns to test the breakout level and there is a confirmation signal from a candlestick pattern, such as a bullish candle in an uptrend or a bearish candle in a downtrend.
- Stop loss: In a clear uptrend, place it just below the support level that was just broken and retested, conversely, in a downtrend, place it just above the resistance level that was broken.
Fibonacci retracement strategy
The Fibonacci retracement tool helps traders identify key price zones where a pullback could end. Popular levels such as 50% and 61.8% are often used as potential entry points. In an uptrend, traders look for buying opportunities when prices correct to these levels, while in a downtrend, they wait for prices to retrace to execute a sell order, helping to optimize entry points and manage risk effectively.
- Entry point: Open a position when the price touches important Fibonacci levels and there is a confirmation signal from price action, such as the appearance of a Pin Bar candle showing buying pressure in an uptrend.
- Stop loss: In an uptrend, place below the 61.8% Fibonacci level, in a downtrend, place above this level to limit risk if the market goes against your prediction.
Common pitfalls when trading pullbacks
When learning what a pullback is, many traders encounter common pitfalls that can lead to losses. Understanding common mistakes will help traders take advantage of pullback opportunities more effectively and make accurate decisions in volatile markets.
- Mistake in distinguishing between pullback and reversal: This is a common mistake of many traders. Pullback is just a short-term adjustment in the current trend, while reversal marks a complete change in the direction of the market.
- Ignore market signals: Always consider the whole market picture, including factors such as economic news, financial data and other external influences before making a trading decision.
- Leverage abuse: Using high leverage can be very risky, causing serious losses if the price moves in the opposite direction during a pullback.
Conclude
Understanding what is a pullback is an important step for traders to take advantage of trading opportunities within a trend while managing risk. Pullbacks provide favorable entry points and can help optimize profits when analyzed correctly. By combining price action, technical indicators, and market context, traders can make informed decisions and avoid confusing a pullback with a trend reversal.


