In technical analysis, Reversal Candlestick Patterns are an important tool that helps traders identify potential changes in market direction. These patterns provide early signals so that traders can proactively enter or exit the market before a real trend reversal takes place.
To make it easier for you to get familiar and apply them effectively, PF Insight introduces the top 5 most common reversal candlestick patterns. By mastering these patterns, you can significantly improve your entry quality and increase your ability to accurately detect reversal signals.
- Top 5 remote Prop Trading Firms for 2025 – The best platforms for funded traders
- What is hedging? A complete guide for traders and investors
- What is a bullish pattern? 3 high-probability setups every trader should know
What are reversal candlestick patterns?
Reversal candlestick patterns are formed by one or more candles and signal that the current market trend may be about to change direction. All patterns act as a warning of potential reversal, but their level of reliability varies. Some provide strong and clear signals, while others require additional confirmation from market context or technical factors to increase accuracy.
There are two main types of reversal patterns: bullish and bearish.
- When a downtrend is coming to an end, bullish reversal candlestick patterns often appear, signaling the potential start of a new uptrend.
- Conversely, when an uptrend has extended and begins to weaken, bearish reversal candlestick patterns may appear, indicating the risk of a downward reversal in the near future.
What are reversal candlestick patterns?
Top 5 most common reversal candlestick patterns
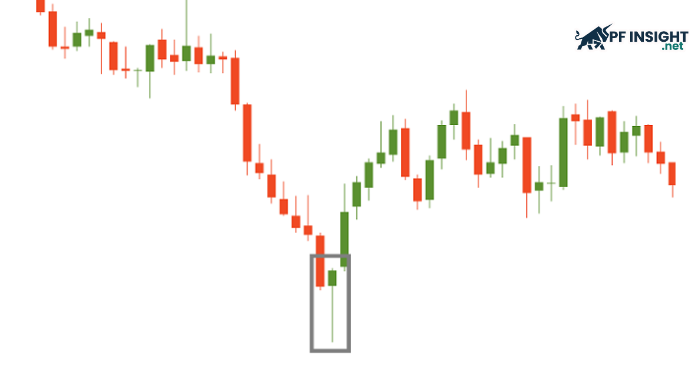
Morning Star Pattern (Bullish)
The Morning Star is a three-candle pattern that typically appears at the bottom of a downtrend and signals a potential bullish reversal. The structure of the pattern consists of three parts:
- The first candle is a long bearish candle, showing that sellers are still in control and trying to maintain downward pressure.
- The second candle has a small body and usually gaps down from the first candle. It can be bullish or bearish, often appearing as a spinning top or doji, indicating market indecision.
- The third candle is a strong bullish candle that gaps up and closes above the midpoint of the first candle’s body. This shows that buyers have returned and regained control.
When these three candles appear consecutively, they form a reliable bullish reversal signal, especially when the pattern appears at a key support level or after a strong decline.
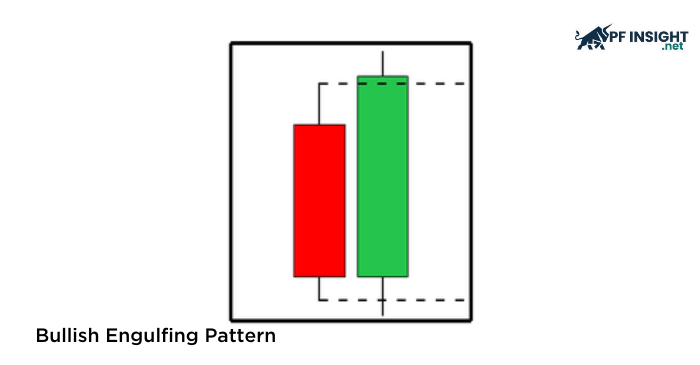
Hammer Pattern (Bullish)
The Hammer is one of the most common bullish reversal candlestick patterns, typically appearing at the bottom of a downtrend and signaling a potential upward reversal. The structure of the Hammer is easy to identify:
- The candle has a small body near the top of the price range.
- The lower shadow is at least twice the length of the body, indicating strong initial selling pressure.
- The upper shadow is very short or nonexistent, showing that the price closed near the high of the session.
In terms of market psychology, the Hammer forms when sellers push the price down strongly during the session, creating the long lower wick. However, buyers then step back in aggressively, driving the price higher and closing near the top. This shows that the sellers’ final push failed and buyers took back control, signaling a potential bullish reversal in the following sessions.
The Hammer can be either bullish or bearish, but its shape is the key factor. A bullish (green) Hammer usually gives a stronger signal because it shows that buying pressure was strong enough to close near the session high.
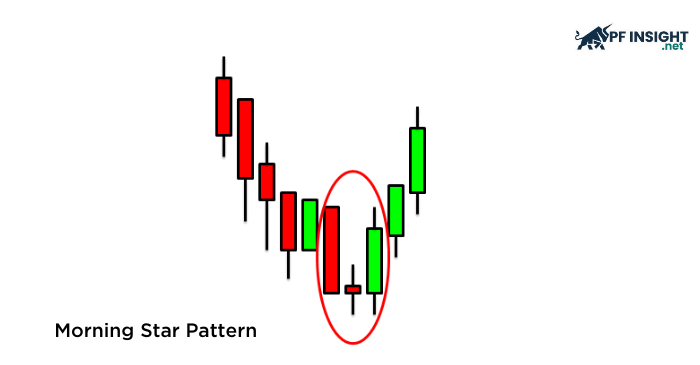
Bullish Engulfing Pattern
Bullish Engulfing is another well-known and easy-to-spot bullish reversal candlestick pattern. Like many patterns, it has two versions: bullish and bearish. Here, we focus on the bullish version, which gives a strong signal that buyers are taking control from sellers. The pattern consists of two consecutive candles:
- The first candle is a bearish candle, showing that sellers are still dominant at that time.
- The second candle is a long bullish candle whose body completely engulfs the previous candle, indicating a strong shift in market sentiment.
What is a bullish engulfing pattern?
Bullish Engulfing typically appears after a clear downward move. The second candle usually opens slightly below the first candle’s close (a small gap down), showing that sellers are still trying to push lower. However, buying pressure then surges, driving the price higher and closing above the first candle’s open, fully engulfing its body. The second candle usually has a short upper wick because buyers dominate the entire session.
In terms of psychology, this pattern shows a clear power shift: sellers dominate the first candle, but buyers completely take over on the second, pushing prices up and signaling a potential bullish reversal.
Shooting Star Pattern (Bearish)
The Shooting Star typically appears at the top of an uptrend. It is easy to recognize:
- The body is small and located near the bottom of the candle, usually slightly bullish or bearish.
- The upper shadow is long, typically at least twice the size of the body, showing strong upward pressure during the session.
- The lower shadow is short or nonexistent, meaning the price closed near the bottom.
The candle opens with bullish momentum, buyers push the price up, creating the long upper wick. But when the price reaches resistance or a level where buyers are no longer willing to pay higher, sellers step in and push the price back down to near the open.
Regardless of whether the Shooting Star is bullish or bearish, it is considered a bearish reversal signal. What matters most is the shape of the candle and its location, usually at the top of an uptrend or near a strong resistance zone.
Bearish Engulfing Pattern
Bearish Engulfing is the bearish counterpart of the Bullish Engulfing pattern. It typically appears at the top of an uptrend and signals a potential downward reversal. Its structure consists of two consecutive candles:
- The first candle is a small bullish candle, continuing the current uptrend and showing buyer dominance.
- The second candle is a long bearish candle that opens above the first candle’s close and then drops sharply, closing below the first candle’s open, fully engulfing its body.
In terms of market psychology, buyers are initially in control, pushing prices higher. However, sellers return strongly and push prices lower, not only erasing the previous gains but fully engulfing the bullish candle. This represents a clear power shift from buyers to sellers. That is why Bearish Engulfing is often seen as an early warning signal of a potential decline or a reversal from bullish to bearish.
How to use reversal candlestick patterns effectively
Accurately identifying reversal candlestick patterns is only the first step. To trade successfully, traders must place the pattern in the right market context and use additional confirmation factors to increase reliability. Here are some important principles to use reversal candlestick patterns effectively:
Combine with support and resistance levels
Reversal patterns are more reliable when they appear at key price levels, such as support, resistance, supply and demand zones, or previous highs and lows.
For example, a Morning Star pattern forming at a strong support zone usually has a much higher probability of success compared to one appearing randomly in a ranging market.
Therefore, always identify key price zones first, then watch if reversal patterns form at those levels.
Use multiple timeframes
You can avoid trading against the broader trend by checking patterns across multiple timeframes.
For example, if the daily or H4 timeframe is in an uptrend or near strong support, a bullish reversal pattern on the H1 timeframe will be more reliable.
On the other hand, if you trade a bullish reversal on a lower timeframe while the higher timeframe is still in a strong downtrend, the chance of a false signal is higher.
It’s better to trade in the direction of the higher timeframe trend or wait for extra confirmation.
Combine with volume and simple indicators
A key element for confirming the strength of a reversal signal is trading volume.
For bullish reversal patterns, a bullish candle accompanied by high volume indicates genuine buying interest returning to the market.
Conversely, a bearish reversal pattern combined with increasing selling volume indicates clear distribution pressure.
You can also use basic indicators like moving averages, MACD, or RSI to make more confident trading decisions.
Confirm the Signal Before Entering
Do not enter a trade just because you see a pattern. Wait for a clear breakout from the price range or a confirming candle aligned with the pattern.
For example, to confirm bullish strength after a Hammer, wait for another strong bullish candle to close above it. This helps reduce the risk of entering too early before the pattern is fully confirmed.
Practice proper risk management
Even with high-probability patterns, no signal is 100% accurate. Always:
- Place your stop loss below the pattern for buy orders, or above the pattern for sell orders.
- Determine your take profit level based on support and resistance levels or appropriate R:R ratios (for example 1:2 or 1:3).
- Avoid over-leveraging just because the pattern looks good.
Conclusion
One of the simplest and most useful tools for spotting major market turning points is reversal candlestick patterns. By mastering the top 5 most common patterns, you can build a solid foundation for improving entry timing and reading charts more effectively.
However, understanding the patterns alone is not enough. To achieve good results, traders must apply them within the correct market context, confirm signals with other technical factors, and always follow proper risk management principles. When used correctly, reversal candlestick patterns can become a key part of your trading strategy, helping you enter trades with more confidence and increase your overall success rate.
Find more of our technical analysis articles in the Technical Analysis section.


