For new traders, the exclusive trading environment can be both exciting and intimidating. It is a valuable opportunity to access large capital without risking personal capital, but to achieve this, traders must pass a rigorous evaluation process. Mastering and effectively using the best Indicators for Prop Firm challenge will help traders improve performance, minimize mistakes, and increase their chances of success.
This article by PF Insight will provide useful indicators and strategies to help traders not only conquer the Prop Firm challenge but also create a solid foundation for trading success.
What is a trading indicator?
Trading indicators are technical analysis tools built from price, volume, or open interest data of an asset. They help traders identify trends, predict future price movements, and better understand market behavior. Thanks to the signals given by indicators, traders can optimize entry and exit points. Currently, there are many popular groups of indicators such as momentum indicators, trend indicators, volatility indicators and volume indicators.
Application of indicators in trading
Application of indicators in trading
By combining indicators, trading signals can become more reliable and the possibility of false signals can be reduced. With proprietary trading, choosing the best Indicators for Prop Firm challenge, will help you be more successful.
Trend identification: To confirm the trend, traders can apply moving averages along with momentum indicators such as RSI or MACD. For example, an uptrend is clearly confirmed when the price remains above the moving average and the RSI shows a strong upward trend.
Make accurate decisions: Traders need to develop a clear analytical system, combining risk management and technical indicators to increase trading performance. Optimizing long-term profits by avoiding emotional decisions and limiting errors through the use of supporting tools such as RSI, MACD or Bollinger Bands.
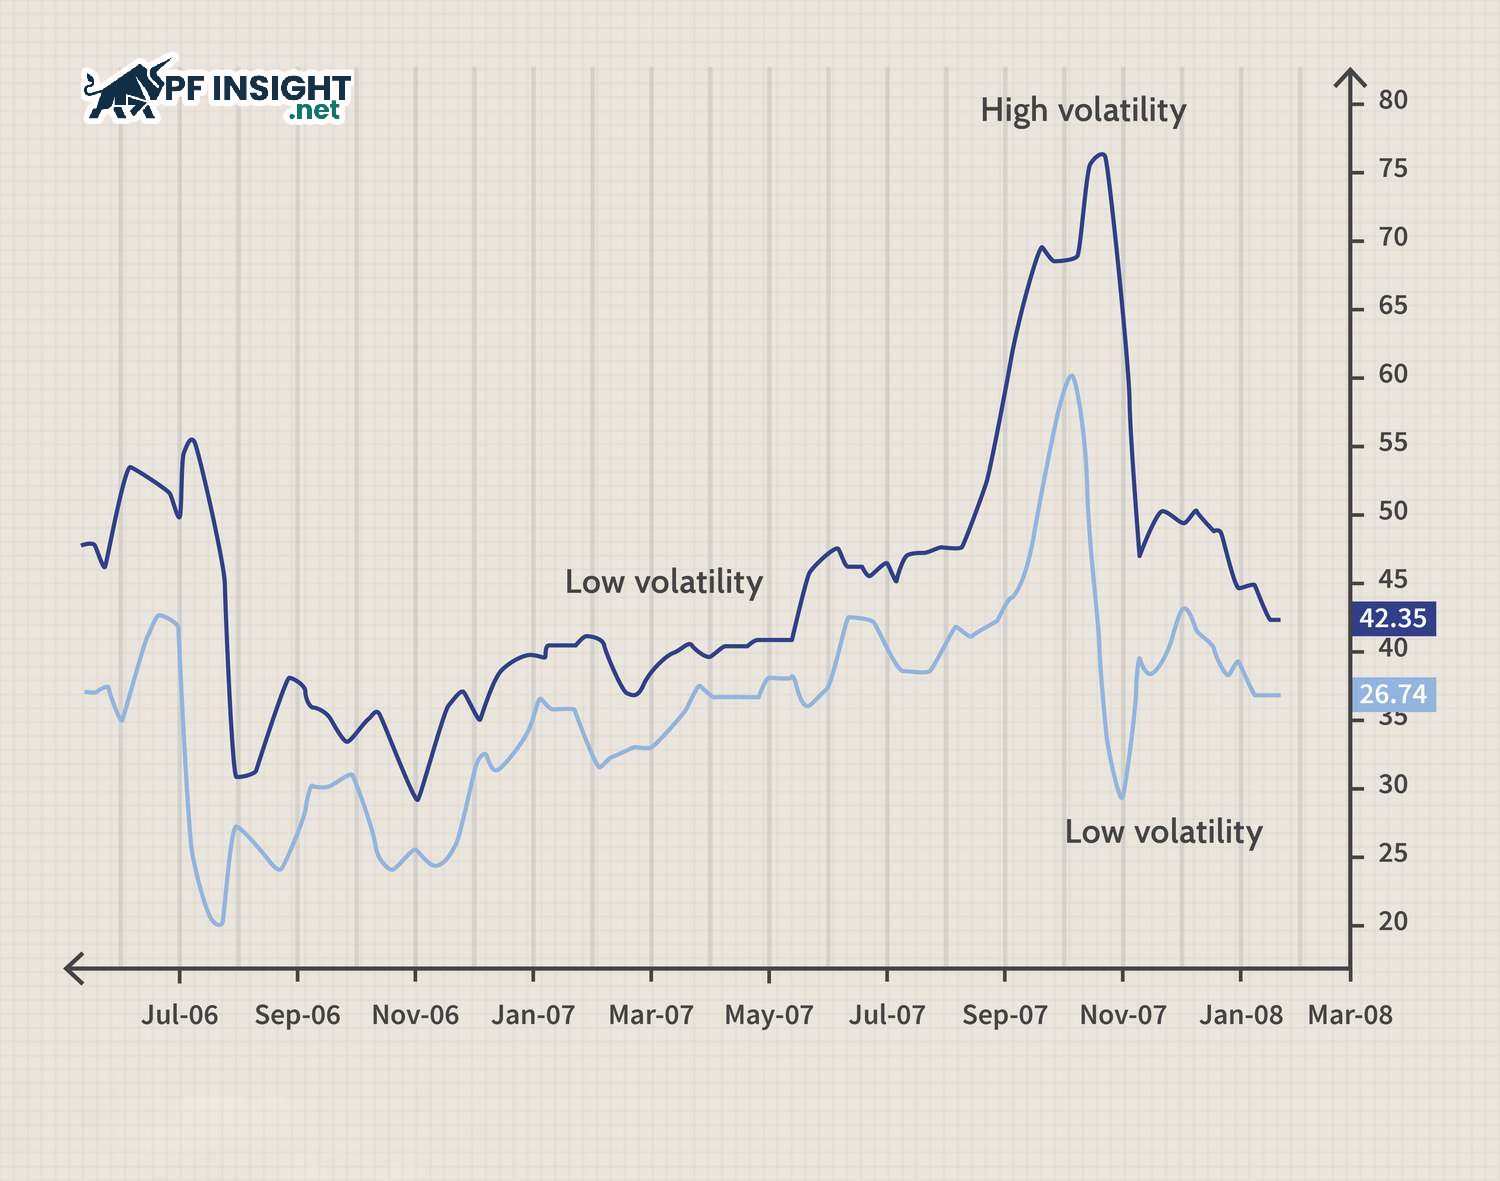
Measuring volatility: To analyze market volatility, combine the ATR with the Bollinger Bands. If the ATR indicator shows a significant increase in price volatility as the price approaches the outer Bollinger Band, traders should consider increasing their stop loss.
Divergence signals: Combine multiple indicators when analyzing divergence to improve the accuracy of detecting a possible reversal. For example, the trading signal will often be stronger if both the MACD and RSI deviate from the price trend.
Best Indicators for Prop Firm challenge
Trading performance can be improved by choosing the right best Indicators for Prop Firm challenge. This tool will provide useful information on trend, momentum, volatility and reversal signals, helping traders adjust to changing market conditions as well as meet the strict requirements of the prop firm.
MACD (Moving average convergence divergence)
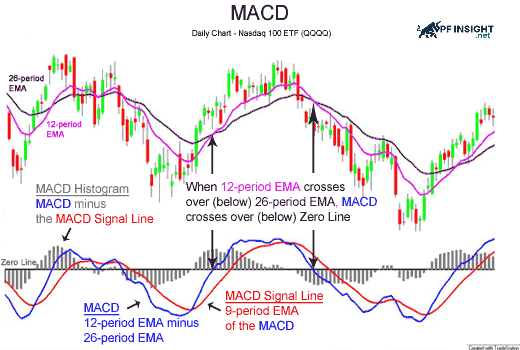
MACD is a Best Indicators for Prop Firm challenge based on the relationship between two moving averages of prices
MACD is a Best Indicators for Prop Firm challenge based on the relationship between two moving averages of prices, combining trend and momentum. The MACD line, signal line and histogram are the three main components of this tool, helping traders identify trading signals.
How to use: Traders often look for a crossover between the MACD line and the signal line to determine a buy or sell signal. Furthermore, divergence between price action and the MACD can signal a potential trend reversal. The histogram also provides a visual representation of the strength or weakness of market momentum.
Moving average
One of the best Indicators for Prop Firm challenge is the moving average. This tool helps traders identify market trends more clearly. There are two main types including Simple Moving Average (SMA) and Exponential Moving Average (EMA), each with its own characteristics, suitable for different trading strategies.
Traders can use moving averages to smooth out data and identify trends and price patterns over a given period of time. EMA reacts quickly and sensitively to new fluctuations because it focuses more on recent prices. On the other hand, SMA provides stability and reduces volatility by averaging prices over a predetermined period of time.
How to use: The market is usually in an uptrend when the price is above the moving average, whereas a downtrend may be forming if the price is below the moving average. Additionally, when a shorter-term moving average crosses a longer-term moving average, such as the 50-day MA and the 200-day MA, potential buy or sell signals often appear.
Bollinger Bands
Bollinger Bands consist of three parts: two upper and lower bands that represent the standard deviation from the SMA line, and a middle band that represents the SMA line. This tool helps traders determine the range of possible price movements as well as the market volatility.
How to use: The market can be overbought when the price is close to the upper band, and oversold when the price is close to the lower band. To increase the accuracy of trading signals, Bollinger Bands are often used in combination with other indicators. In addition, when the Bollinger Bands are narrowed, low volatility and strong breakout potential of the market are indicated.
Relative strength Index (RSI)
A popular momentum indicator that measures the speed and scale of an asset’s price movements is the Relative Strength Index (RSI). RSI is typically displayed on a scale of 0 to 100 and is calculated over a 14-day period.
How to use: When the RSI exceeds 70, the market may be overbought, while when the RSI falls below 30, it is an oversold signal. These levels are often used by traders to identify potential trend reversals. In addition, the divergence between the RSI and price action also plays an important role in predicting the possibility of a change in market direction.
Average true Range (ATR)
ATR helps traders grasp the range and risk of price movements.
This indicator, which represents market volatility, calculates the average difference between the high and low prices over a specific period of time. It is a best Indicator for Prop Firm challenge, helping traders grasp the range and risk of price movements.
How to use: ATR is an important tool that many traders use to adjust trading volume and set stop-loss orders. Stop-loss orders are often placed wider to avoid being wiped out too early when the ATR is high, indicating high market volatility. On the other hand, a low ATR indicates low market volatility, allowing traders to maximize their risk management approach by applying a tight stop-loss order.
Volume Indicators
Volume Indicators are an important group of indicators that help traders assess the strength of a trend through volume data. The two most popular types are:
Volume Moving Average (VMA) – allows smoothing of data to identify volume trends
On Balance Volume (OBV) – helps confirm price momentum based on changes in trading volume.
How to use: Market strength and support for the current trend is often reflected when price movements are accompanied by high trading volume. On the other hand, low trading volume movements can indicate an unsustainable trend. Traders use volume indicators to confirm new trends or breakout signals. For example, a high volume breakout is more likely to be reliable and long-lasting.
Stochastic oscillator
The Stochastic Oscillator calculates the correlation between the current closing price and the price range over a given period, usually 14 days. This indicator helps traders detect buy or sell signals by oscillating on a scale of 0 to 100.
How to use: The market may be overbought when the stochastic oscillator is above 80, and oversold when it is below 20. The intersection of the %K and %D lines, where %D is a smoothed version of %K, often provides important signals. Furthermore, potential trend reversals are often indicated by divergence between the indicator and price action, helping traders spot potential trading opportunities.
Fibonacci retracement
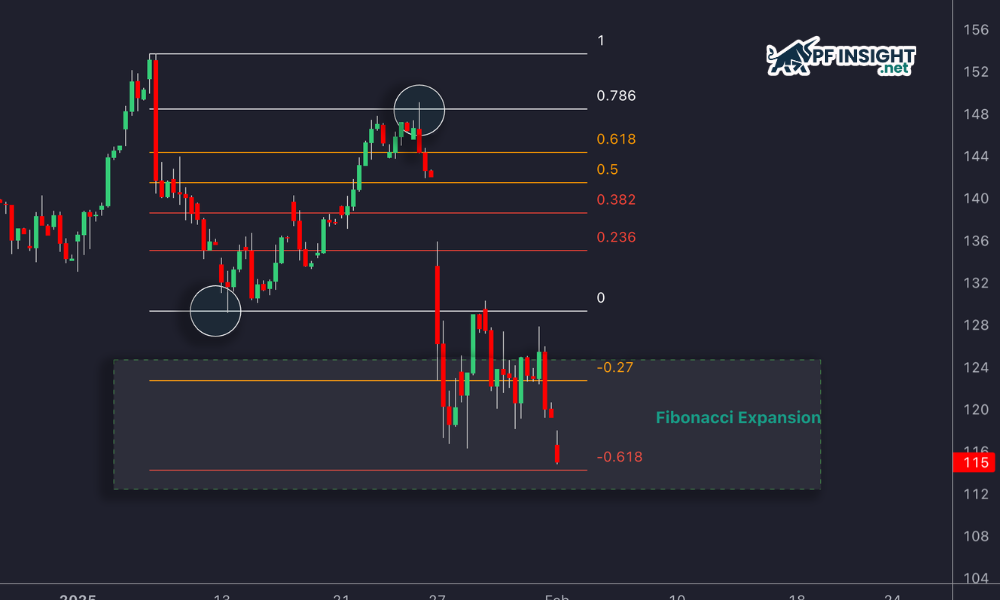
Fibonacci levels are often used by traders to identify potential reversal zones during price corrections.
The horizontal lines on the chart represent Fibonacci retracement levels, based on the Fibonacci sequence and help identify potential support and resistance areas. This is a best Indicators for Prop Firm challenge, allowing traders who want to predict when a price trend will reverse.
How to use: Fibonacci levels are often used by traders to identify potential reversal zones during price corrections. They will wait for a retracement to levels such as 23.6%, 38.2% or 61.8% when the market is in a strong uptrend to identify opportunities to place orders within the main trend. These levels are considered natural support or resistance zones, helping to make more accurate entry point choices.
Ichimoku Cloud
One of the best indicators for Prop Firm challenge to analyze trend, momentum and support and resistance zones is the Ichimoku Cloud. It provides traders with a comprehensive view and consists of 5 main components: Chikou Span, Tenkan-sen, Kijun-sen, and two lines Senkou Span A and Senkou Span B.
How to use: The “cloud” part of Ichimoku consists of the Senkou Span A and Senkou Span B lines, which are important support and resistance zones. A market uptrend is indicated when the price is above the cloud; a downtrend is confirmed when the price is below the cloud. Furthermore, when the Tenkan-sen crosses the Kijun-sen, signaling a change in momentum, potential trading signals often appear.
Build a trading strategy based on indicators
Once the best Indicators for Prop Firm challenge have been selected, traders need to build a clear and logical strategy. A clever combination of indicators will help optimize trading signals. Here are some important factors to consider:
Build a trading strategy based on indicators
Define your own trading style
Determining your trading style will directly affect how you use indicators. For example, short-term traders often focus on fast-moving oscillators, while long-term traders are more interested in the larger trend and key support and resistance levels.
Scalping: In this style, traders often have to act quickly, relying on short-term signals provided by indicators such as moving averages (MA) or RSI. Decisions are often made within minutes to take advantage of small price fluctuations.
Day Trading: Day trading requires flexibility, so combining trend indicators with momentum tools such as MACD is often applied. This combination helps traders assess the strength of the current trend and find effective entry points.
Trend Trading: Trend trading focuses on tracking major patterns on the daily chart. Longer term tools such as Bollinger Bands are used to identify the main trend, assisting traders in determining appropriate entry and exit points.
Set up order opening and closing rules
Set clear rules for opening and closing orders based on the best Indicators for Prop Firm challenge. This helps remove emotions from the trading process and brings consistency and discipline in making buy or sell decisions.
An entry signal may be formed when the 50-day MA crosses above the 200-day MA and at the same time the RSI shows oversold territory below 30.
Exit rules should be determined based on the desired profit target or when a clear reversal signal appears.
Apply risk control methods
In the challenges of proprietary trading firms, effective risk management plays a key role, helping traders protect capital, maintain account stability and increase the likelihood of passing the strict criteria set by the firm.
Predetermine the risk level for each transaction, for example not exceeding 1% of account capital.
Apply the ATR indicator to set a reasonable stop loss, accurately reflecting the actual volatility of the market to preserve capital.
Review your trading plan
Before implementing a strategy in the real market, test it on historical data. This will help you evaluate its effectiveness, identify its strengths and weaknesses, and fine-tune your strategy for better results.
Stay disciplined in the face of challenges: This is key to passing the self-employed exams. Some helpful tips include:
Stick to your trading plan.
Avoid making emotional or hasty decisions due to psychological influences.
Trading diary: Record details of orders, psychology when entering orders and results to regularly evaluate and improve performance.
Market Watch: Keep up to date with economic and financial news that can affect trading, but stay calm and avoid overreacting.
Conclude
In the environment of proprietary trading companies, choosing the best Indicators for Prop Firm challenge plays a key role in building a profitable strategy. No indicator provides absolute guarantees, but if applied properly, traders can read the market more accurately, determine effective buying and selling times and manage risks closely. Ultimately, success comes from combining trading discipline, technical analysis ability and sensitivity to market fluctuations.